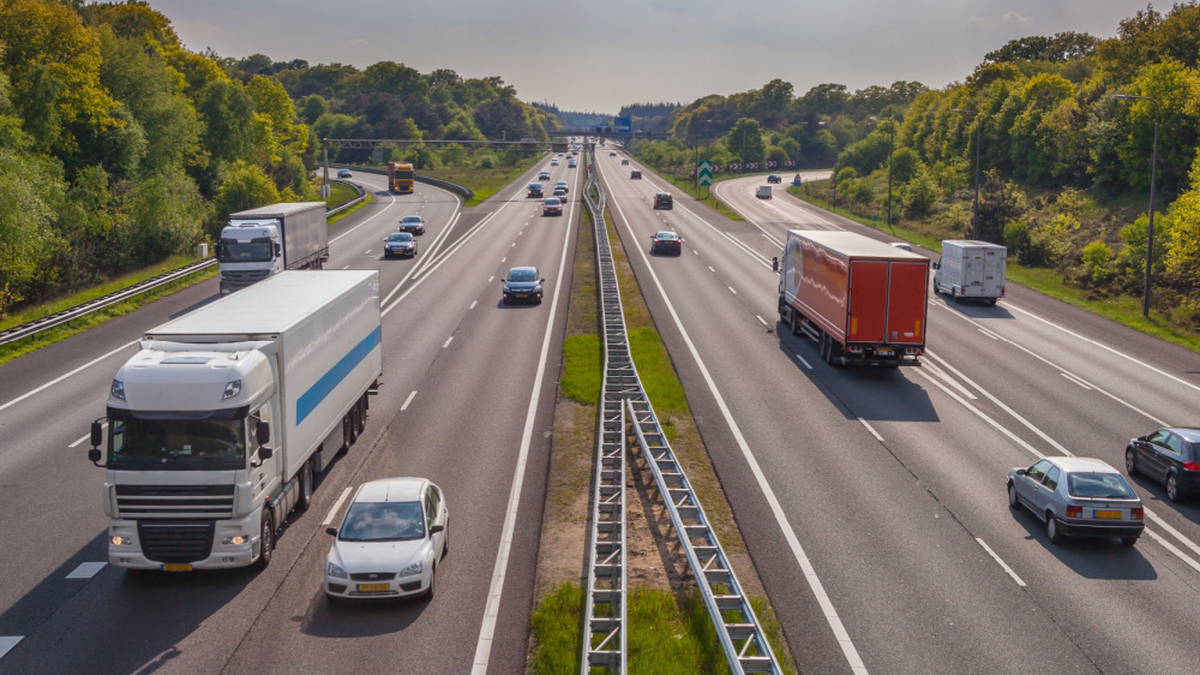
Eurostat released data on September 24th showing that in 2025, the EU transported 13.29 billion tons of goods by road, an increase of 1.8% compared to 2024. This growth rate is not particularly rapid, but it provides a direct perspective on the real economy: it indicates how much raw materials, food, and industrial products were actually transported by trucks, which is closer to production and consumption activities than the emotional indicators in surveys. However, the total tonnage only tells us "how much" was transported and does not indicate how far the goods were carried, nor can it be directly equated with economic value.
In terms of weight, metal ores and products from mining and quarrying account for 3.04 billion tons, accounting for 22.9% of EU road freight; food, beverages, and tobacco account for 1.61 billion tons, or 12.1%; other non-metallic mineral products also amount to about 1.6 billion tons, representing 12.1%. Ores, sand, gravel, and building materials are heavy in weight and are usually transported between the place of extraction and the sites of processing and construction, which is why they easily dominate in terms of tonnage.
Tons of kilometers have resulted in a new ranking, with food becoming the category with the highest transportation intensity.
If the weight is multiplied by the transportation distance, measured in ton-kilometers, food, beverages, and tobacco account for 311.1 billion ton-kilometers, which is 16.6% of the total, making them the largest category. Mixed cargo accounts for 237.1 billion ton-kilometers, or 12.6%; agricultural, forestry, and fishery products account for 206.3 billion ton-kilometers, or 11.0%. This indicates that although food is not the heaviest, it often travels over longer distances and enters a wider distribution network.
The distinction between tons and ton-kilometers is very important for economic analysis. A truckload of sand and gravel traveling dozens of kilometers may contribute a significant amount of weight but does not consume much long-distance transport capacity; whereas a truckload of food crossing several countries has a lower weight, but it requires more drivers, vehicles, fuel, and storage time. Logistics costs, road wear, and carbon emissions are usually more closely related to ton-kilometers rather than just the total number of tons.
Food ranks first in terms of ton-kilometers, which also indicates that the European supply chain is highly dependent on continuous road transportation. Fresh and cold-chain goods have high requirements for timing, temperature control, and transfer stability; therefore, increases in fuel prices, driver shortages, or delays at borders will more quickly be reflected in retail costs. Companies can alleviate some of this pressure by optimizing warehouse distribution and routes, but it is not possible to completely eliminate the physical distance between the place of production and consumers.
An annual growth of 1.8% needs to be interpreted with caution. The increase in freight transportation may stem from an actual expansion in demand, or it could be due to the handling of inventory, concentrated transportation of construction materials, or longer routes. If the distance per unit of goods transported increases, the increase in ton-kilometers may outpace the increase in tons; if production becomes more localized, an increase in tons may also be accompanied by a decrease in distance. A comprehensive judgment should also take into account industrial output, retail sales, and construction activities.
Dangerous goods account for only 4%, yet they require higher levels of supervision and accident preparedness.
In 2025, hazardous goods accounted for 4.0% of the ton-kilometers of road freight in the European Union, including flammable liquids, toxic substances, and explosive materials. Although this share may seem small, the risks cannot be simply proportionally assessed. The transportation of hazardous goods requires specialized vehicles, driver training, route management, and emergency response mechanisms; the external costs of a single accident can be much higher than those of ordinary goods.
There are significant differences between countries. In Finland, hazardous goods account for 9.8% of road freight ton-kilometers, in Ireland it is 7.8%, and in Cyprus 7.5%; in Lithuania, it is only 0.7%, while in Portugal and Slovakia it is 1.9% each. These differences may stem from energy structures, industrial compositions, port locations, and domestic transportation distances, and cannot be directly used to evaluate which country has better or worse regulation.
Eurostat also reminds that the proportion of hazardous goods is small, and the uncertainty in the investigations is higher than that of ordinary goods. Malta is not covered by the relevant EU road freight statistics regulations, therefore it is not included in this set of data. By retaining methodological limitations when reporting these rankings, it is possible to avoid misinterpreting minor changes as definite trends.
For policymakers, the growth of road freight transportation affects infrastructure, labor forces, and emission reduction targets simultaneously. Roads require maintenance, and the working conditions of drivers impact transport capacity. The electrification of heavy vehicles or the use of alternative fuels are still constrained by range, refueling, and load capacity. Shifting some long-distance shipments to railways or waterways can reduce the burden on roads, but the "last mile" of delivery and many flexible routes still rely on trucks.
What enterprises are more concerned about is how costs are passed on. Vehicle purchases, wages, fuel, insurance, and fees collectively determine freight rates. When demand grows by only 1.8%, any significant increase in one of these costs can have a greater impact on profits than changes in the volume of goods transported. Therefore, freight data should be considered alongside freight rates and indicators of corporate bankruptcy and recruitment; it is not appropriate to conclude that the industry is booming based solely on an increase in transportation volume.
The regional structure also affects the transportation efficiency of the same type of goods. Warehouses located near consumption centers can shorten the last leg of delivery, but they require more land and inventory; centralized distribution centers have scale advantages, but once the main roads are blocked, the impact is more widespread. There is no one-size-fits-all solution for companies to choose between the lowest costs and greater resilience; they should decide on their network layout based on the shelf life of the goods, delivery commitments, and alternative routes.
Digital scheduling can reduce idling and waiting times, but it cannot overcome all physical constraints. Tractors not being able to find cargo on their return trips, urban traffic restrictions, regulations on rest times, and the lack of charging infrastructure can all affect vehicle utilization. If transportation volume increases moderately while effective capacity grows more slowly, freight rates may still rise. When assessing industry pressures, vehicle mileage, idling rates, driver hours, and total tonnage are all equally important.
The price changes that consumers ultimately see usually lag behind the transportation costs. Large retailers may use long-term contracts to temporarily lock in shipping rates, while smaller businesses are more quick to accept spot quotes; the energy and equipment costs for the food supply chain are also higher than those for ordinary goods. Even if annual volumes only increase by 1.8%, there may still be localized shortages of transport capacity on certain routes and for certain categories of goods, and the actual pressures faced by businesses cannot be dismissed by using the EU average figures.
The key information from this annual data is that road logistics in the EU is still expanding moderately, and there are significant differences in how different categories of goods utilize the transportation network. Ores and building materials contribute to the total weight of transported goods, food and agricultural products drive the intensity of long-distance transportation, while hazardous goods impose additional regulatory requirements. Understanding these patterns is more helpful in explaining the pressures that roads, prices, and supply chains are facing than simply citing a figure of “13.29 billion tons.”