Key Points
- Boeing's stock price is reported at $188.70, down from $191.96, due to a software failure in the 737 MAX that has triggered regulatory scrutiny.
- The daily line RSI14 is at 30.03, approaching the oversold area, and the bar chart of MACD has expanded to -0.86.
- Stock price below three key moving averages: 20-day moving average of $203.23, 50-day moving average of $210.67, and 200-day moving average of $218.05
- Daily chart ATR14 rose to 6.27, with the stock price closing below the lower band of the Bollinger Bands at 191.30 USD.
- In a bearish scenario, the daily support level of $186.61 is to be watched; bulls need to regain the daily pivot point of $189.59.
Interpretation of Boeing's Daily Stock Chart
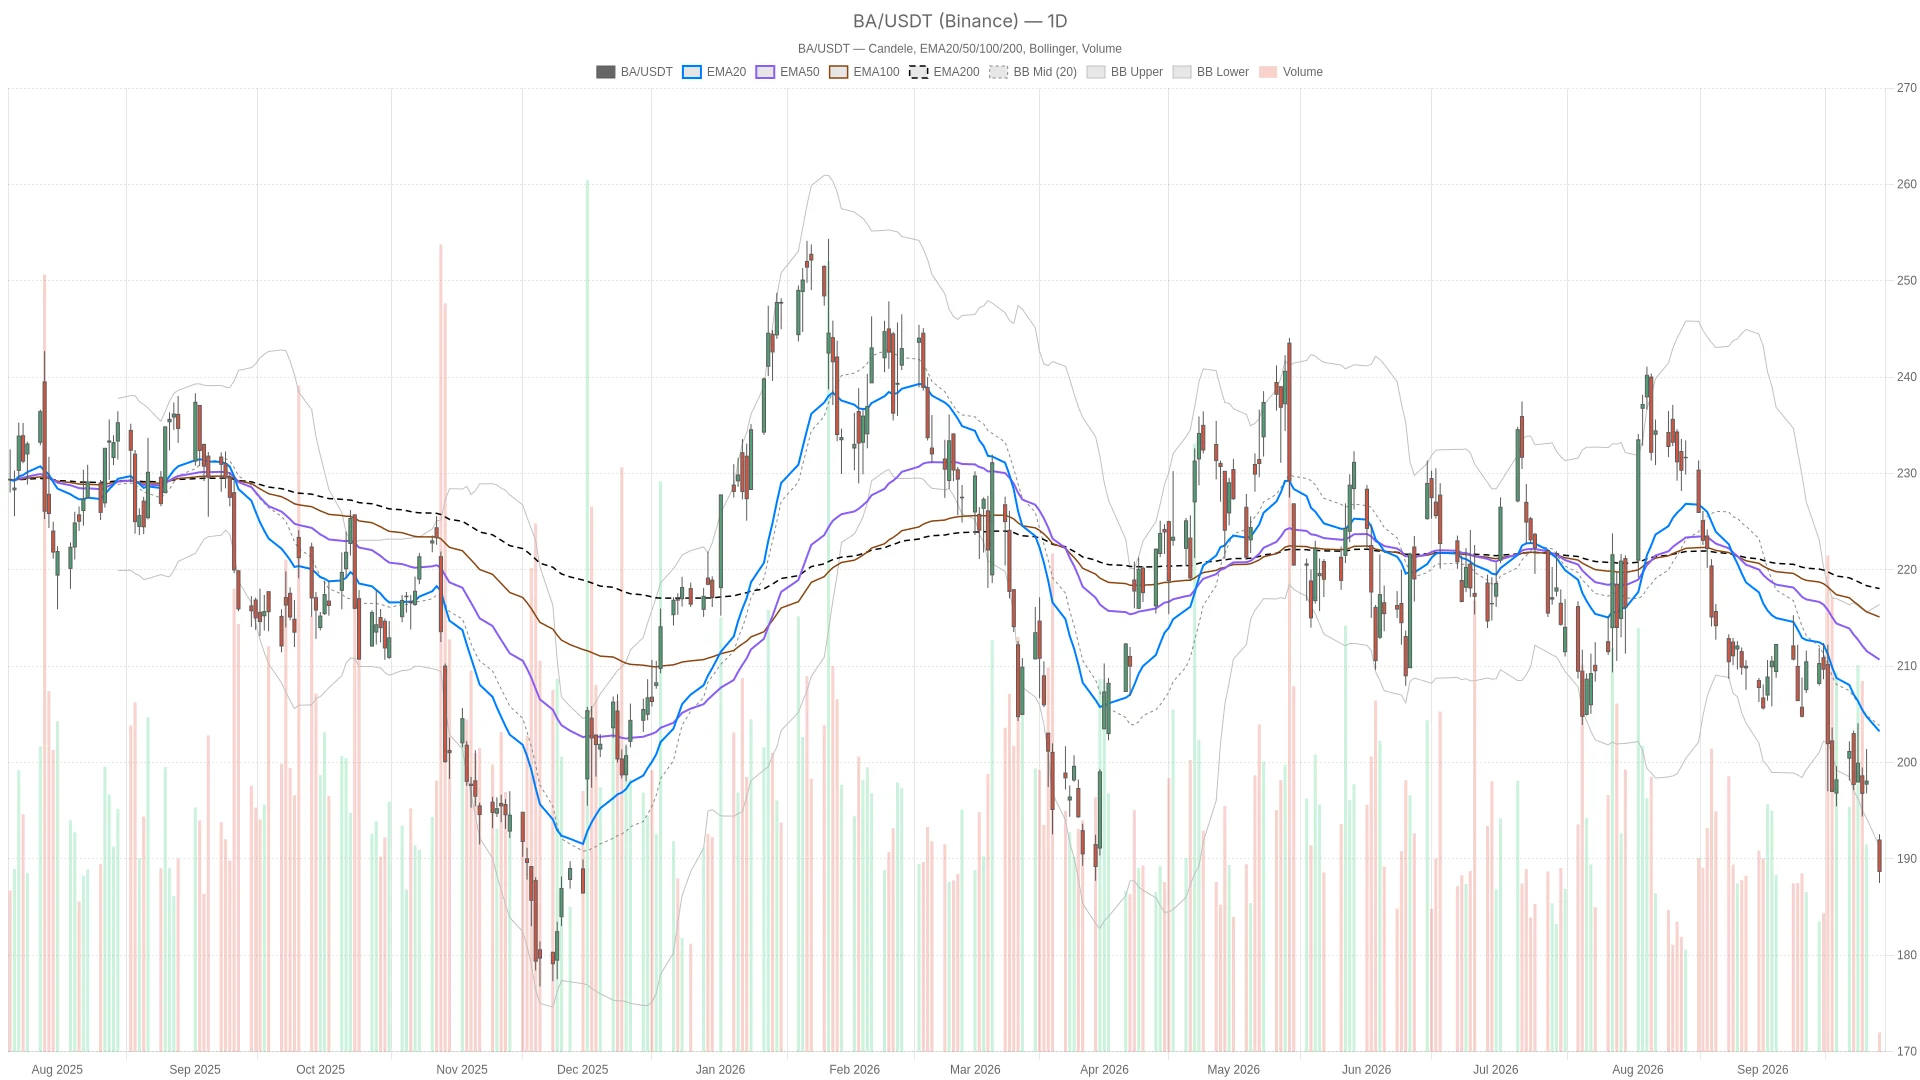
The daily chart of Boeing's stock price shows a typical bearish structure. The price is below three key moving averages, and momentum indicators are still accelerating downward.
All major trend indicators are unfavorable for the bulls. The 20-day EMA is at $203.23, the 50-day EMA is at $210.67, and the 200-day EMA is at $218.05. This arrangement—where short-term, medium-term, and long-term moving averages are all above the current price—confirms a bearish tendency.
Volatility has further reinforced this signal. The daily ATR14 has risen to $6.27, which represents a significant range of fluctuation for Boeing's stock price. The price has already fallen below the lower Bollinger Band at $191.30, with the middle band at $203.85.
After such a rapid decline and closing outside the lower band, it usually indicates two possibilities: either it is an extreme oversold condition that may lead to a rebound; or a stronger downward trend has just begun. Considering the latest regulatory news, the second scenario seems more likely.
The daily pivot point is at $189.59. The support level is at $186.61, and the resistance level is at $191.68. In the coming trading days, these key levels will be very important.
Hourly chart confirms a bearish trend.

The hourly chart of Boeing's stock price further reinforces the bearish trend on the daily chart, with no meaningful divergences observed.
On the hourly chart, EMA20 is at $194.86, EMA50 is at $198.20, and EMA200 is at $207.18; the moving averages are also pressing down on the prices in a bearish manner. This is completely consistent with the daily chart settings. At the hourly level, RSI14 is at 27.83, which indicates a deeper entry into the oversold region than the daily reading. The bar chart for MACD shows -1.07, and this trend is still expanding. The line for MACD is at -2.68, which is below the signal line of -1.61.
Therefore, the hourly chart does not soften the overall picture; rather, it strengthens it. The price is close to the H1 pivot point of $188.73, with broader structural resistance at only $188.92 and support at $188.51. This exceptionally narrow range indicates that the market is digesting the stream of news rather than clearly choosing a direction.
15-minute chart shows initial signs of stabilization
The 15-minute chart only shows initial signs of Boeing's stock price stabilizing in the short term, but these signs are not sufficient to constitute a reversal signal.
RSI14 has risen to 34.07, higher than the weaker hourly readings. It is worth noting that the MACD bar chart has slightly turned positive to +0.23. However, the MACD line remains at -2.19, below the signal line of -2.42. This is a typical short-term momentum stagnation within the overall trend.
On the 15-minute chart, the positions of EMA are still relatively sparse. EMA20 is at $190.49, EMA50 is at $193.79, and EMA200 is at $198.70. The prices are still below the middle band of the Bollinger Bands, which is $190.09. Overall, the 15-minute chart provides details at the level of trade execution, rather than indicating a change in trend direction.
Bullish scenario for Boeing stock price
To achieve a real rebound, the bulls must first re-establish themselves above the daily pivot point of $189.59 and hold onto the level above the hourly pivot point of $188.73.
If it is able to break through the daily resistance of $191.68 (marked as R1), it will be the first important signal that the oversold condition has begun to trigger a real short-covering movement. The daily RSI is approaching 30, and the hourly RSI is approaching 28, indicating that the market is in a compressed state, but compression does not necessarily equate to a reversal.
For the 15-minute chart MACD bar chart to show a positive change, similar shifts need to occur on the hourly and daily time frames as well to be truly significant. Even so, regaining the level of $203.23 on the daily chart EMA20 will still be the next real test, and this level is still quite far from the current price.
Short-selling scenarios and key failure points
For Boeing's stock price, a bearish scenario would only require the continuation of the current downward trend. If it falls below the daily support level of $186.61, it will confirm the continuation of the decline.
ATR14 has risen to $6.27, indicating that larger intraday fluctuations have become the norm. Regulatory news surrounding issues with the 737 MAX software has added additional pressure, and technical support levels alone may not be sufficient to absorb this pressure.
If the pivot point of H1 at $188.73 cannot be held during any rebound attempts, the initial signs of stabilization on the 15-minute chart will become invalid. This will open the door to retesting the lower band of the daily Bollinger Bands and even lower levels.
Overall, evidence from both the daily and hourly time frames indicates a bearish market trend. Trend, momentum, and volatility indicators are all pointing downward. The 15-minute chart only provides slight, early signs of stabilization and should not be mistaken for a reversal.
Given that the reading of ATR is on the high side, and the regulatory review related to 737 MAX has not yet been resolved, volatility may continue to remain high. Careful consideration is needed when arranging positions around Boeing's stock price. Before the situation becomes clearer, the daily S1 support levels at $186.61, as well as the pivot range around $188.70 to $189.59, are the most useful reference points.
Frequently Asked Questions
What caused the stock price of Boeing to fall?
The decline was triggered by news of a software failure in the 737 MAX landing system, and this issue has drawn attention from regulatory authorities for investigation. The news caused the stock price to fall by approximately 1.7%.
What is the key support level for Boeing's stock price?
The daily support level for S1 is at $186.61. The pivot range around $188.70 to $189.59 is the current direct reference area. The hourly pivot level of $188.73 and the daily pivot level of $189.59 are also key levels that need attention.
Is Boeing's stock price currently in a state of oversold?
What signals indicate a bullish reversal in Boeing's stock price?
For the bulls to move forward, they first need to regain support at the daily pivot point of $189.59 and break through the resistance level of $191.68 ($R1). A more significant recovery would require them to also surpass the $203.23 level on the daily chart ($EMA20), along with a concurrent shift in momentum at higher time frames ($MACD).
Disclaimer:This article is for informational purposes only and does not constitute financial advice, investment recommendations, or an invitation to buy or sell any financial instruments or cryptocurrencies. The analysis provided in this article does not represent future results. Investing in crypto assets and financial markets carries a high risk of capital loss. Before making any decisions, please conduct your own research ( DYOR ) and consult with a qualified financial advisor.
This article was generated with the assistance of artificial intelligence and has been reviewed by an editorial team.