

As of press time, Bitcoin is trading in a tug-of-war between $84,000 and $86,000. On one side is "Uptober"—from 2013 to 2025, Bitcoin recorded gains in 10 out of 13 Octobers, with an average return of about 19%. On the other side is $4.35 billion in long leverage corresponding to liquidation risk at $74,170. In our view, institutional target downgrades, fading ETF inflows, and long-term holder accumulation are intertwined, making October a volatile month.
Table: Bitcoin Latest Price Key Data
| Metric | Value |
|---|---|
| Bitcoin Current Price | $83,400–$84,200 range |
| Long Leverage Exposure (30-day) | $4.35 Billion |
| Short Leverage Exposure (30-day) | $1.65 Billion |
| Short-term Short/Long Ratio (7-day) | Shorts $1.96B / Longs $1.03B |
| ETF Consecutive Net Inflows | 7 trading days, cumulative $2.98 Billion |
| ETF Single-Day Inflow Peak and Decay | Peak $999M → $21.34M on September 25 |
| Dense Short Liquidation Zone | ~$4.79 Billion in the $75,982–$83,575 range |
| Long-Term Holder Net Position Change | 23,172 BTC |
| Exchange Bitcoin Reserves | Binance ~689,000 BTC; network-wide ~2.7 million BTC |
| Bitcoin Open Interest Change | Decreased by ~49,000 BTC over 7 days |
Note: The above content is compiled and summarized by CoinMeta based on public market data. Please refer to actual data if there are any fluctuations.
Why Are Institutions Broadly Downgrading Their 2026 Targets?
Before discussing Bitcoin's price in October 2026, let's look at a background that cannot be ignored: mainstream institutions have clearly turned cautious on their 2026 Bitcoin price outlook.
Standard Chartered downgraded its target twice in 2026, cutting it from $150,000 to $100,000, and warned that Bitcoin could first fall to $50,000 before recovering. Meanwhile, TD Cowen analyst Lance Vitanza also lowered his end-2026 target from $140,000 to $97,500.
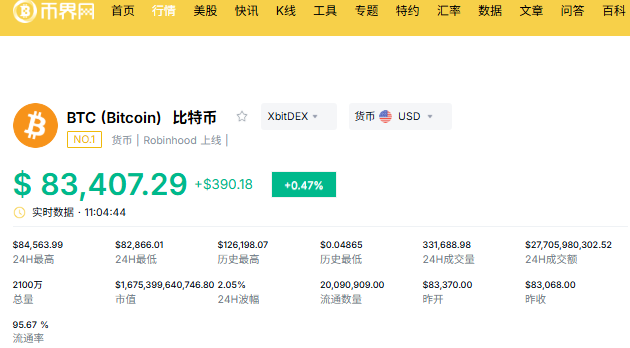
Image: Bitcoin Latest Price
Three major banks did the same thing within half a year, which itself says something.
But our view is: institutional target downgrades are essentially an "after-the-fact acknowledgment" of the first half's price action, not a "forecast." The market has already stabilized above $84,000, while TD Cowen's target is only $97,500, meaning it itself believes there is still 25% upside. Institutions talk cautiously, but the numbers they give are not actually pessimistic. In our view, if the historical average 19% October gain materializes, Bitcoin would directly surge into six figures, leaving most institutions' year-end targets behind. This tension is the core contradiction in current pricing.
The Deep Contradiction Between Bitcoin's Capital Flows and Leverage Structure
Can Bitcoin's historical 19% October gain materialize? In our view, we must examine the true state of capital flows and leverage structure. The current market presents a set of intriguing contradictory signals.
Long-Term Holders Are Quietly Buying
We tracked the Hodler Net Position Change indicator for Bitcoin long-term holders. It was negative for most of August, indicating old players were selling. But the indicator turned positive on August 31 and had recovered to 23,172 BTC by September 27. Additionally, addresses holding 10,000 BTC have bought another 41,025 BTC in the last 10 days, bringing total holdings to 13.64 million BTC, or 67.93% of the total supply—the highest level since the mid-August rally.
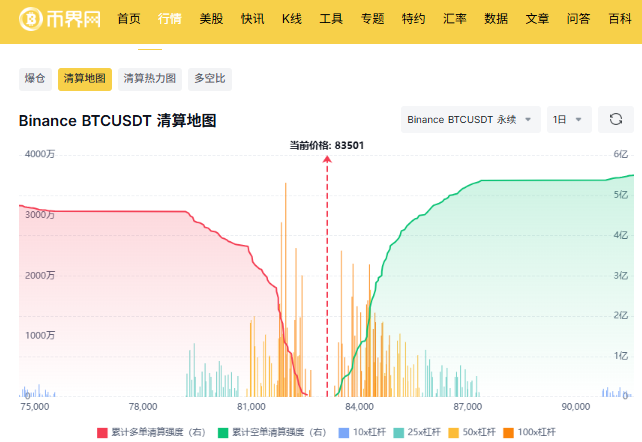
Image: Bitcoin Long-Term Holder Position Changes
In our view, Bitcoin long-term holders are locking up chips with real money. The weight of this signal is far greater than short-term price fluctuations.
Leverage Market Risk
Binance's short positions over the past 7 days were $1.96 billion, exceeding long positions of $1.03 billion. This means that if the price rises even slightly, shorts could be squeezed, creating a short squeeze.
But don't be fooled by this short-term data. Extending the cycle to 30 days, the truth is completely reversed: total long positions are worth $4.35 billion, while shorts are only $1.65 billion, a net leverage heavily skewed long. CoinMeta's liquidation map shows that around $245 million in potential short liquidations sit near $87,660. If the price reaches $90,278, that number jumps to $575 million.
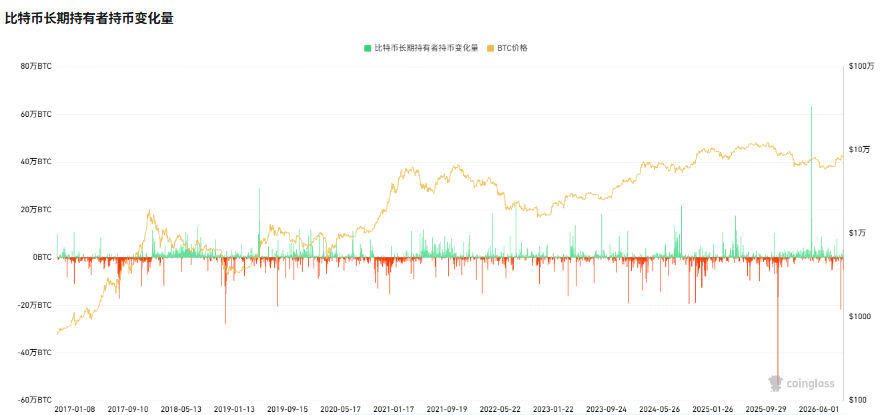
Image: Bitcoin Liquidation Map
In our view, short-term short squeezes and medium-term long overload coexist. This structure itself means October volatility will not be small. Rallies could be fierce, but once it turns, the $4.35 billion in long leverage is the most vulnerable link.
Bitcoin ETF Inflows Are Slowing
Since September 17, Bitcoin spot ETFs have recorded net inflows for 7 consecutive trading days, totaling $2.98 billion, pulling 2026 cumulative net inflows from negative back to positive $886.8 million. Sounds good, right?
But look at the pace of inflows: on September 21, a single day saw $999 million rush in. By September 25, only $21.34 million remained. In five days, it shrank by nearly 98%. By September 28, although the consecutive inflow streak continued, single-day net inflows had dropped to $31 million, less than 400 BTC, while at the start of last week nearly $1 billion corresponded to over 11,000 BTC.
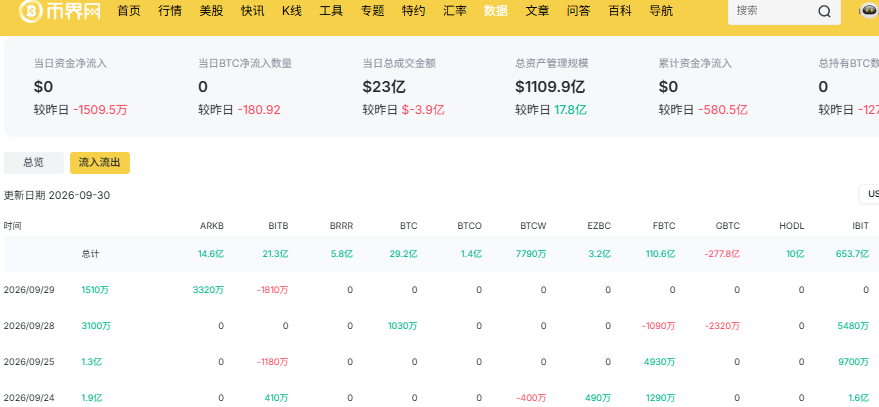 Image: Bitcoin ETF Flows
In our view, October's upward path will not be smooth, and the historical 19% average gain was never a straight line. The fluctuations in between are enough to wipe out a batch of highly leveraged positions.
Can Historical Patterns Repeat?
Historically, Bitcoin's strong October performance has some correlation with the halving cycle. Coinbase CEO noted that October to December after a halving is usually a strong period.
However, the lesson from October 2025 is fresh.
That month, Bitcoin was still at $119,000 at the beginning, briefly surging to $126,000 to set a new all-time high, and the market was euphoric. Then US-China trade friction suddenly escalated, and the crypto market suffered over $19 billion in the largest liquidation in history. The record of seven consecutive Octobers of gains vanished in an instant.
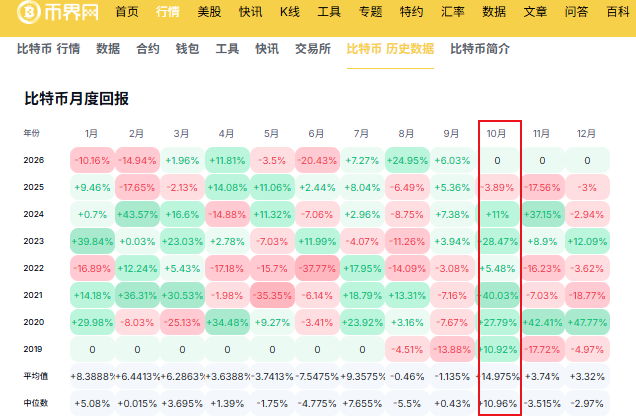
Image: Bitcoin Historical Returns
Our view is: don't treat the "Uptober historical pattern" as a get-out-of-jail-free card. The 19% average gain is a statistical fact, but you need to see under what conditions it occurred. Now $4.35 billion in leverage hangs overhead. If the price breaks below the key support of $80,811, weak capital flows could push it to the dense long position area near $74,957, where the intensity of liquidation shocks would far exceed a normal correction. In our view, historical patterns help you understand probabilities, but the leverage structure determines whether you survive this October.
Bitcoin 5-Year Outlook:Bitcoin 5-Year Outlook: $75.5K Miner Cost, Crash or Floor?
Bitcoin October Price Outlook FAQ
Can Bitcoin's price in October 2026 deliver the historical 19% gain?
Answer: Not necessarily. The historical average gain is only a statistical reference. Currently, $4.35 billion in long leverage coexists with fading ETF inflows. If it holds above $87,360 and capital flows accelerate back, it could materialize; if it breaks below $80,811, liquidation pressure will clearly suppress gains.
Will the $4.35 billion leverage overhang cause a Bitcoin crash in October?
Answer: There is risk, but a crash is not inevitable. If the price breaks below the key support near $80,811, the $4.35 billion in long leverage could trigger cascading liquidations and test $74,957. If support holds and triggers a short squeeze, the price could instead move higher.
Can long-term holder accumulation drive Bitcoin's price up in October 2026?
Answer: It can provide support, but it is difficult for it alone to drive a major rally. The Hodler Net Position turning positive and falling exchange reserves are structural positives, but fading ETF inflows and high leverage remain the main variables. Whether October rises depends on capital sustainability and key level breaks.

Conclusion
In our view, the key to Bitcoin's price in October 2026 is not historical patterns, but the game between $4.35 billion in leverage and capital flows. If it holds above $87,360 and ETF inflows accelerate back, the historical 19% gain still has a chance. If it breaks below $80,811, liquidation pressure will dominate. Investors should closely watch leverage levels and capital flows, rather than simply betting on "Uptober."
Disclaimer: Readers are strictly advised to comply with local laws and regulations. This article is compiled based on public market data for reference and educational purposes only, and does not constitute investment advice. Follow CoinMeta for the latest updates.