

Near Protocol has not given up
Hyperliquid begins to decline
Has the organization of Ethereum come to an end?
There has been a clear change in the direction of XRP.
Near Protocol ( NEAR ): NEAR remains strongly bullish above $5.00, but its ongoing momentum increases the risk of a pullback, unless it breaks through the $5.40-$5.50 range.
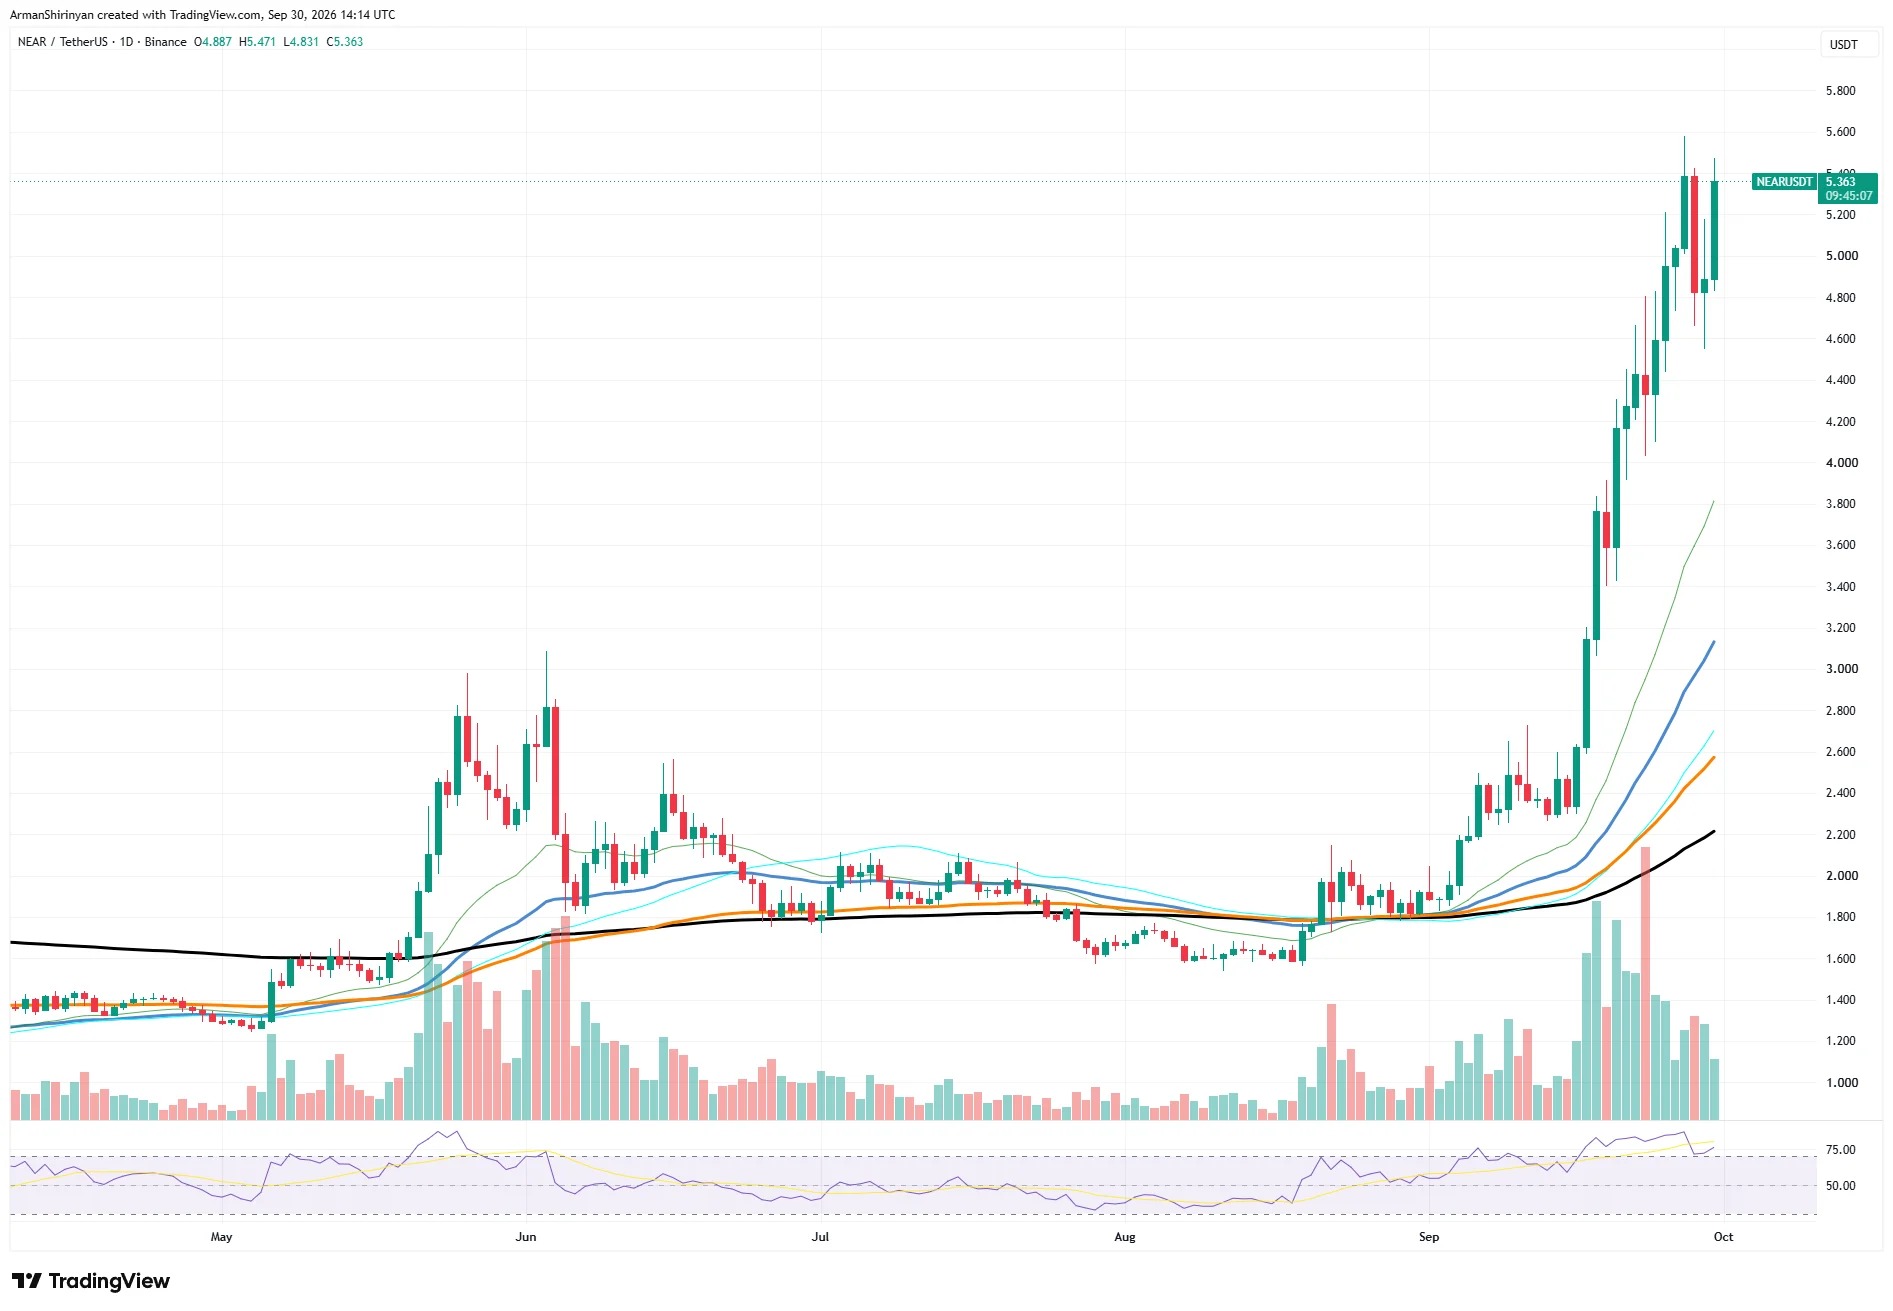
Hyperliquid ( HYPE ): HYPE started to correct after the rebound in September, and $85-86 is the key support needed to maintain a broader upward trend.
Ethereum ( ETH ): ETH is undergoing constructive consolidation around $2,700. If it breaks through $2,800, it could pave the way for a rise towards $3,000.
XRP ( XRP ): XRP maintains a improved bullish structure above $1.50, but to move further upward, it still needs to break through the $1.55-$1.65 range.
Near Protocol has not given up
Near Protocol continues to demonstrate one of its strongest driving forces.
The fundamental background has also strengthened. The spot NEAR ETF of Bitwise was listed on NYSE Arca on September 29th, which provided another catalyst for this round of gains; at the same time, there has been an increase in activity surrounding NEAR Intents, and the narrative of the network leaning towards AI continues to attract market attention.
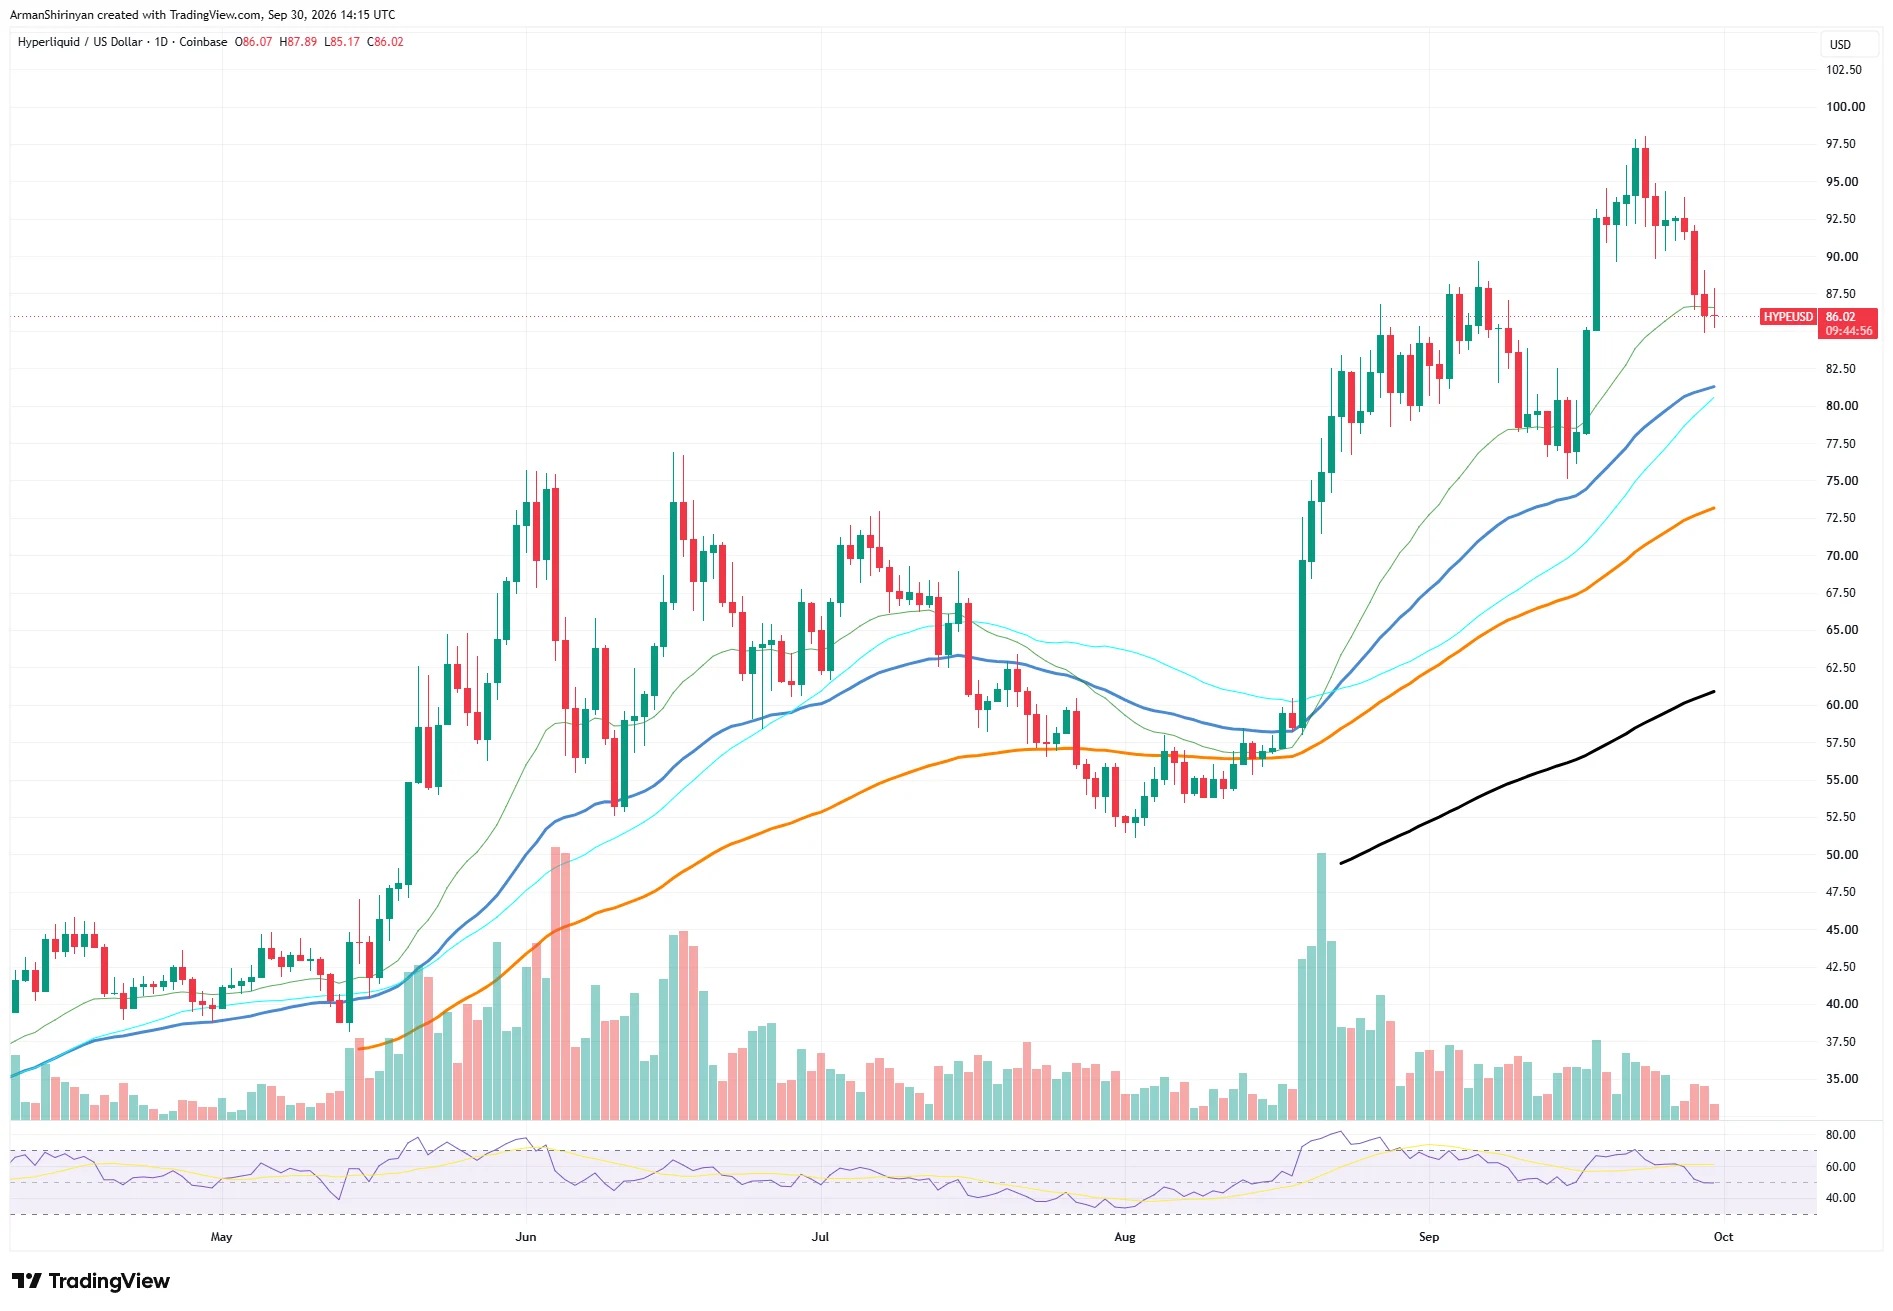
However, from a technical perspective, NEAR has become extremely overbought. The price has risen almost vertically from the range of $2.40-$2.60 and is currently far above all the major moving averages shown on the daily chart. The short-term moving averages have risen to around $3.80, while the longer-term moving averages are still much lower. This separation confirms the strength of the trend, but it also increases the likelihood of a sharp correction.
RSI is still close to the 70-75 range and was in an overbought area for a long time during this round of gains. Importantly, NEAR continues to set higher highs and lower lows, which indicates that there has not yet been a confirmed trend reversal.
The current resistance level is around $5.40-$5.50, and several recent K-lines have encountered selling pressure at this level. If the daily chart can close strongly above this area, it will clear the recent local upper limit and may expose $6.00 as the next psychological target.
Hyperliquid begins to decline
After a rebound in September pushed the token to $97-98, Hyperliquid has entered a clear correction phase. HYPE is currently trading at around $86.14, which is nearly 12% lower than its recent high, and it is situated in an important short-term support area.
The broader trend remains constructive. The breakthrough in September HYPE pushed the asset price from around $57 to nearly $100, with the price still operating above the medium and long-term averages. As one of the largest decentralized perpetual contract platforms, Hyperliquid also maintains a considerable level of fundamental activity. However, recent reports indicate that large-scale selling by institutional investors is another source of short-term pressure.
The current issue lies in momentum. After reaching the $97 range, the price failed to break through the psychologically significant barrier of $100; instead, it formed a series of lower highs. The recent daily charts have pushed the price below $90, and it has since fallen back to around the $85-86 level, where the short-term moving average is on the rise.
RSI has also fallen back to near the neutral zone from levels previously close to the overbought area. This cooling down in itself is not necessarily a bearish signal; it has absorbed some of the overheating that accumulated during the upward trend. However, buyers now need to hold onto the current region.
Therefore, HYPE is still in a broader upward trend, but unlike NEAR, its current momentum has turned into a correction. The reaction around $85-86 will determine whether this decline will evolve into a deeper pullback or if it will merely reset its momentum after the expansion in September.
Has the organization of Ethereum come to an end?
After experiencing the strongest rally in months, Ethereum is consolidating around $2,700. ETH is currently near $2,702 and recently reached around $2,800 before encountering resistance. Despite being rejected from rising further, the daily chart still shows a much stronger structure than during the summer.
The key change occurred when ETH broke through the long-term consolidation range of $1,850-$1,950. After the breakthrough, the price almost immediately soared to $2,200, and then expanded to around $2,500. Importantly, during these upward movements, trading volume significantly increased, which gives this breakthrough more confirmation than previous trades with lower volumes.
Thereafter, Ethereum formed a new range between approximately $2,650 and $2,800. This consolidation is quite important, as so far, sellers have not been able to push the price back down to the previous trading range of $2,400 to $2,500.
Momentum is still relatively healthy. RSI has fallen from overbought levels and is currently in the range of over 50 to just over 60. ETH did not collapse along with RSI, but managed to retain most of its gains. This indicates that momentum has been reset, but the price structure has not been correspondingly damaged.
To expand further, Ethereum needs to regain levels between $2,750 and $2,800. If it closes above $2,800 on a daily basis, that would establish a new local high and could potentially pave the way for a push towards the psychological barrier of $3,000.
On the contrary, if it falls below $2,650, it will expose the support levels of $2,600, and even stronger at $2,450-$2,500. However, for now, the consolidation of ETH seems more like a pause after a breakthrough, rather than a confirmed reversal.
There has been a clear change in the direction of XRP.
XRP is currently trading at around $1.52 and has experienced volatility in September that completely changed its medium-term technical structure. In August, XRP was still close to $1.00, then quickly soared to $1.55, pulled back to around $1.30, and later rebounded to the high of September at around $1.65.
One of the most important developments is that the price has broken through the downward resistance line formed after the initial surge at the beginning of September. XRP had continuously formed lower highs below this trend line for several weeks before the latest round of gains, but then successfully broke through upwards. Despite a pullback from $1.65, the price has still remained above the original resistance level.
The structure of the moving averages has also significantly improved. XRP is currently above all the major moving averages displayed on the daily chart. The fastest moving average has risen to around $1.44, while the medium-term moving averages are concentrated in the range of $1.35-1.38. This has formed multiple layers of support below the current market price.
RSI entered an overbought area during the initial breakout in September, before then falling back near the mid-50 level. Overall, this is considered neutral: XRP no longer possesses extreme momentum, but RSI also does not show any significant bearish pressure.
The current key battleground is around $1.50. XRP has been testing this area repeatedly in recent trading sessions, making it an increasingly important short-term pivot point. By holding this position, there will be a chance to attempt again to reach the range of $1.55-1.60, and to challenge the recent high of $1.65.
A bearish scenario would begin with a sustained breakdown below $1.50. This could push XRP towards the $1.44-1.45 range, followed by a stronger $1.35-1.40 zone. Therefore, XRP still maintains a broader bullish structure. However, unlike the sharp rise at the beginning of September, the next upward move will require buyers to prove that they can hold above $1.50 and break through the large supply accumulated between $1.55-1.65.