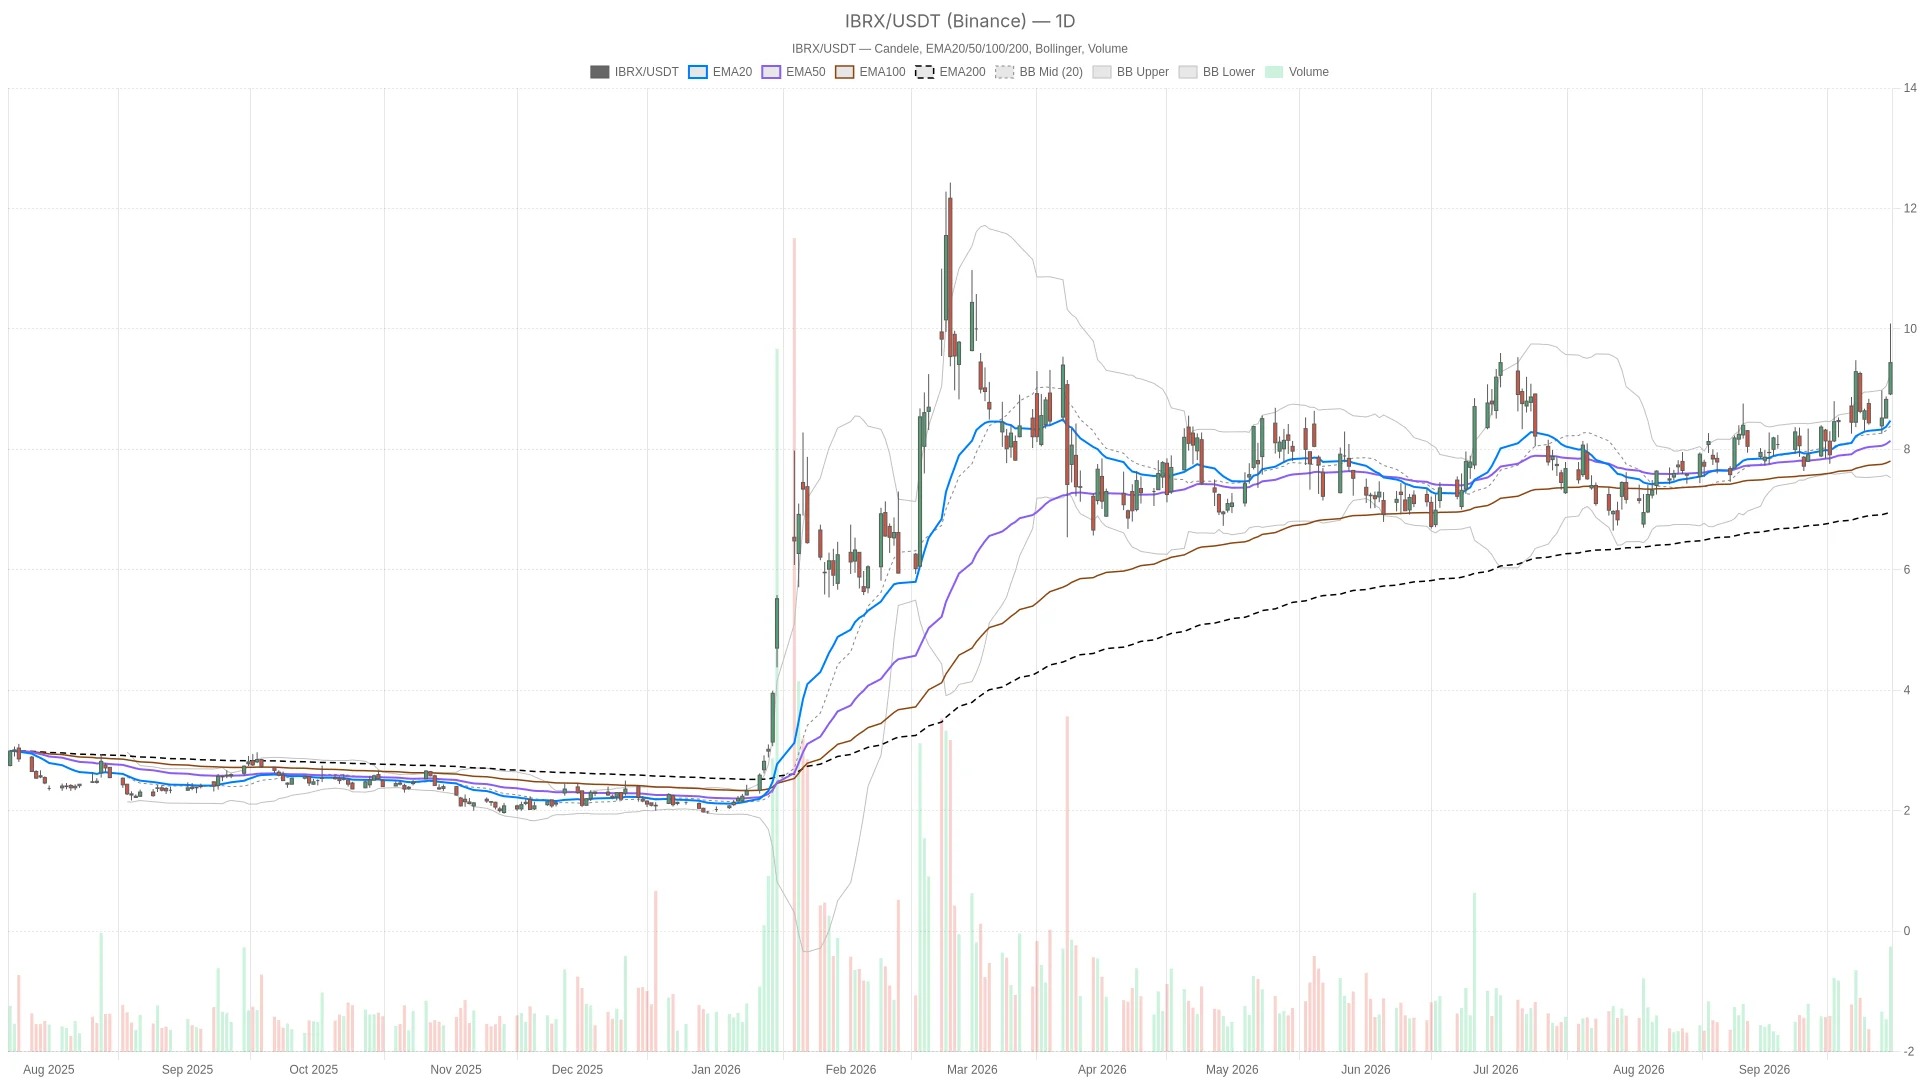
ImmunityBio's stock price rose 6.91% on Wednesday, closing at $9.44, and briefly touched $10.09 during the session, marking the first time it has surpassed $10 since March. After breaking through a level not reached in several months, the bullish sentiment on the daily chart is further supported.
Key Points
- ImmunityBio closed at $9.44 on Wednesday, up 6.91%, and touched $10.09 during the session, marking its first time above $10 since March.
- The daily chart shows that EMA is in a purely bullish position: the 20-day moving average is $8.48, the 50-day moving average is $8.14, and the 200-day moving average is $6.63.
- The daily line RSI14 is at 64.57, indicating strong momentum, but it has not yet reached overbought levels, so there is still room for further upward movement.
- The daily Bollinger Bands upper band, with a closing price above $9.25, indicates an expansion in upward volatility, but there may also be pauses in the short term.
- If it can once again reach the daily pivot point of $9.48 above the closing price, it will help to confirm the breakout and point towards the resistance level of $10.05.
The daily chart structure has clearly turned bullish.
The current daily chart structure is clearly favorable to buyers. The stock price is above the 20-day EMA level, with the 20-day EMA at $8.48; the 20-day EMA is also higher than the 50-day EMA of $8.14; and the 50-day EMA is above the 200-day EMA of $6.63. This is a clear bullish arrangement that usually attracts trend-following funds. The daily RSI14 is at 64.57, which also supports this judgment: there is strong momentum, but it has not yet entered an overbought zone, indicating that there is still room for the market to continue to rise.
Kinetic energy indicator strengthens breakout

The momentum indicator further strengthens the bullish outlook. The daily MACD value is 0.28, the signal line is 0.21, and the bar chart shows a momentum of 0.07, indicating that the momentum is positive and has not yet weakened. It is worth noting that the closing price of $9.44 has broken through the upper band of the Bollinger Bands at $9.25. After a single-day increase of nearly 7%, the closing price has surpassed the upper band, suggesting that the upward movement is expanding rather than weakening. However, this also increases the likelihood of a short-term pause, as the Bollinger Bands need time to catch up with the price changes.
Multi-period analysis indicates a continuation of the trend.
The hourly chart also confirms the bullish outlook of the daily chart; EMA is also in a purely bullish position. The price of $9.43 is above the 20-hour EMA of $9.17, and the 20-hour EMA is higher than the 50-hour EMA of $8.86. The 50-hour EMA is also above the 200-hour EMA of $8.30. The hourly RSI14 is at 59.91, showing a positive trend but without overextension. MACD is almost consistent with the daily chart: the line value is 0.28, the signal line is 0.21, and the bar chart shows 0.07. There is no divergence in momentum between the two time periods.
At the same time, the hourly Bollinger Bands also leave room for an upward movement. The price of $9.43 is still firmly within the Bollinger Band range, with the middle band at $9.05 and the upper band at $10.00. Unlike the daily breakout, this indicates that there is some cushion before the market tests the resistance level again. The hourly pivot point is at $9.50, R1 is at $9.59, and S1 is at $9.34. The price is currently hovering near the pivot area, neither clearly above nor below it.
15-minute chart shows short-term digestion
However, the situation on the 15-minute chart is more complex. This time frame is mainly used for timing of executions, rather than for determining the trend direction. The current price of $9.43 is lower than the 20-period EMA of $9.61, but it is still higher than the 50-period EMA of $9.35 and the 200-period EMA of $8.82, indicating a mixed structure that is not fully aligned. The 15-minute RSI14 is at 43.35, which is below the median line, and the MACD has also turned negative, with a bar chart value of -0.07. The price has also fallen below the lower band of the 15-minute Bollinger Bands at $9.49.
Overall, this indicates a short-term pullback or consolidation following a strong upward movement within the session, rather than a reversal of a larger trend. Therefore, the conflicts between different time frames are more about timing rather than direction. Both the daily and hourly charts support a continuation of the upward trend; the 15-minute chart merely reflects the market's decision on its next move after digesting a large bullish candlestick.
IBRX's fundamental background
In addition to the charts, institutional interest also adds a fundamental aspect to the story of ImmunityBio. A report from Yahoo Finance mentioned that GA - Courtenay Special Situations Fund are optimistic about ImmunityBio. This fund is managed by Green Ash Partners and is described as an opportunity in the cancer market worth $5.8 billion.
In addition, another futures review titled Yahoo Finance, published after the close of trading on Wednesday, included IBRX in the list of stocks to watch. The review was released on the eve of the employment report and also mentioned a significant increase in the yield of 10-year U.S. Treasury bonds. This information can provide useful macroeconomic context, but since it was published after the close of trading on Wednesday, it cannot explain the market conditions of that day.
Bullish and bearish scenarios
A bullish scenario requires a return to the pivot point of $9.48; a bearish scenario, on the other hand, would only truly create pressure if it falls below $8.48. Overall, the evidence from both the daily and hourly timeframes favors the bulls.
If we continue to look at the bullish scenario, the ImmunityBio stock price needs to regain the daily pivot point of $9.48 and stabilize above it. This would open the way to the resistance level of $10.05 and may test again the intraday high of $10.09 that has already appeared this week. As long as the daily RSI indicator has not yet entered overbought territory and the hourly chart continues to close above the $9.50 pivot point, this continuation will be supported. If there is a breakout above the upper band of the daily Bollinger Bands with sufficient trading volume, it will further strengthen the confirmation signal.
On the other hand, for a bearish scenario, it is necessary for the price to clearly fall below the daily line EMA20, which is $8.48. At the same time, it is also required to lose support at $8.86 ($BJWKEEP_00002__) in order to truly create pressure. If the price cannot re-establish itself above the daily pivot point, and if the hourly MACD bar chart turns negative, this will indicate that the breakout is losing momentum, rather than just being a consolidation phase. In such a case, a decline back to $8.86 and the 50-day EMA level of $8.14 will become key areas of observation.
Overall, the evidence on the daily and hourly timeframes supports a bullish outlook for ImmunityBio's stock price. The pullback on the 15-minute chart appears to be more of a short-term digestion rather than a change in trend. At the same time, breaking through the upper band of the daily Bollinger Bands and reaching a higher level of ATR14 indicates that both upward and downward fluctuations are likely to remain at a high level. When trading around the current price, it is necessary to acknowledge this uncertainty, as the stock has just given a clear technical signal. However, the most important thing is still confirmation: whether it can decisively close above the pivot point of $9.48, rather than just focusing on this upward movement alone.
Frequently Asked Questions
ImmunityBio What is the current trend of the stock price?
The daily chart shows that EMA is in a complete bullish alignment, with the price above all three key moving averages. RSI14 is at 64.57, indicating strong momentum, but it has not yet reached overbought levels, so there is still room for continuation.
What resistance levels should investors pay attention to?
The daily pivot point of $9.48 is the level that currently needs to be regained based on the closing price. Above that, $10.05 and the intraday high of $10.09 seen this week are the next key resistance targets for the ImmunityBio stock price.
Is it worth worrying about the 15-minute chart callback?
The callback on the 15-minute chart reflects the short-term digestion after a strong rise, rather than a trend reversal. The daily and hourly charts still maintain a bullish outlook, so this is more of a timing issue rather than a change in direction.
What circumstances would negate a bullish logic?
If it clearly falls below the daily EMA20 of $8.48 and loses the support of $8.86 provided by S1, it indicates that the breakout is losing momentum. In such a case, a price retreat to the 50-day EMA of $8.14 will become a key observation point.
This article was generated with the assistance of artificial intelligence and has been reviewed by an editorial team.