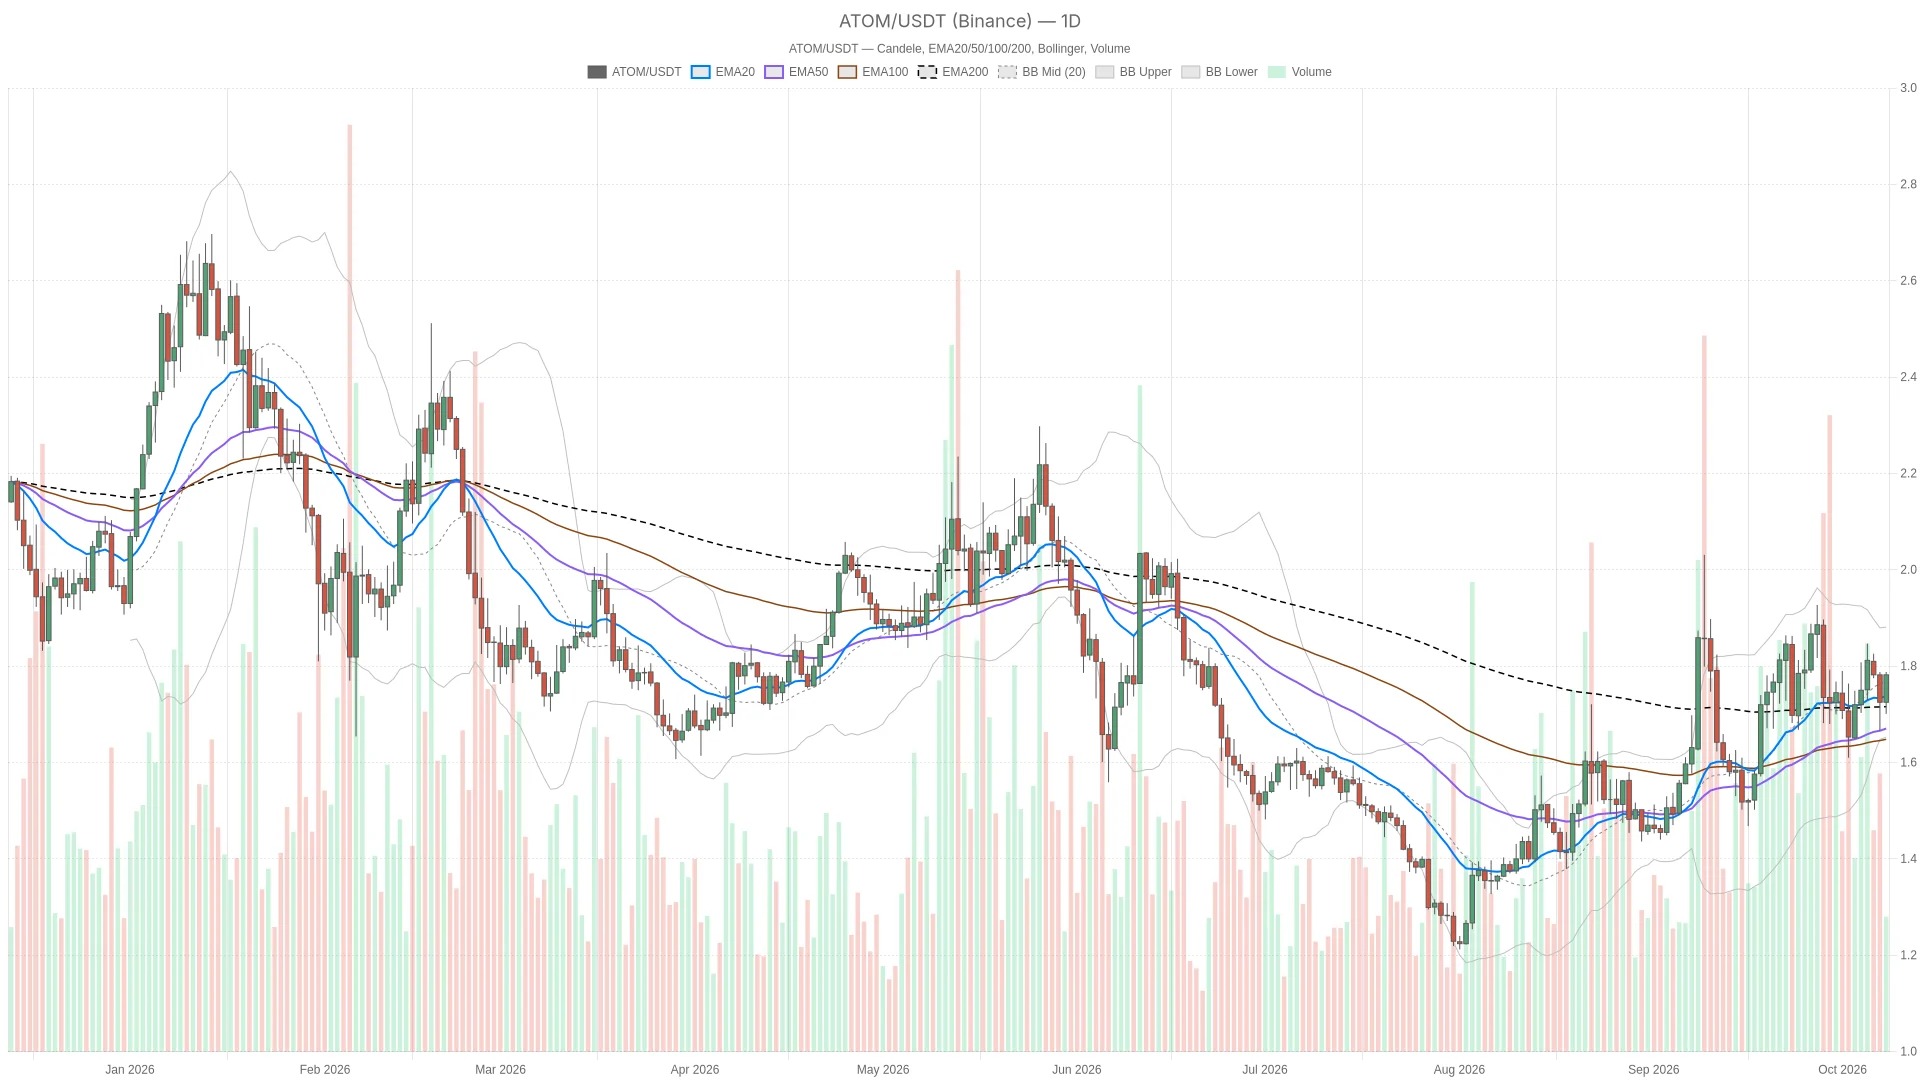
On October 8, 2026, Cosmos ( ATOM ) was trading at $1.78 in Binance. The price is approaching the recent daily line of R1 at $1.79. The daily outlook remains neutral: the price is above the main moving averages, but these averages are not aligned in the same direction, and the completed candlestick patterns do not confirm a bullish trend.
Key Points
- ATOM is trading at $1.78, approaching the support level. R1 faces resistance at $1.79.
- The daily line RSI is at 50.7, and the MACD bar chart shows a negative value, keeping the overall outlook of the daily line neutral.
- Hourly momentum supports an upward trend, but the arrangement of hourly moving averages remains bearish.
- If the daily close price exceeds $1.79, a breakout will be confirmed; if the close price falls below $1.76, then the focus will shift to the support level around $1.73.
- The sentiment index of the crypto market is at 64 (greedy), but the technical analysis of ATOM still needs to stand on its own.
The current tug-of-war is quite evident. The hourly momentum supports an upward trend, yet the daily MACD bar chart still shows negative values, and the daily RSI is also on the decline. The short-term trend holds the upper hand, but the immediate daily resistance above makes "confirmation" more important than just looking at the real-time fluctuations.
Greedful sentiment contrasts with the unconfirmed daily breakout.

Fear & Greed Index indicate that market sentiment is at 64, which falls within the "greedy" range, but this does not explain the weakness in the daily momentum of ATOM. Technical analysis still needs to be considered independently. CoinGecko shows that the total market value of cryptocurrencies is 2.83 trillion US dollars, with Bitcoin accounting for 58.77%. These background levels do not indicate a change in direction, nor do they show any rotation of funds entering ATOM.
ATOM The price has crossed above the moving average, but the trend has not yet aligned uniformly.
The price is above the daily moving averages of EMA20, EMA50, and EMA200, but the arrangement of these moving averages is mixed and does not form a textbook-style bullish pattern. Therefore, the daily chart indicates a neutral bias with an ongoing upward test, rather than a confirmed trend.
The hourly chart further reinforces this distinction. The price is above the hourly levels of EMA20, EMA50, and EMA200, but these moving averages are still arranged in a bearish manner. The current upward trend is stronger than the underlying hourly structure, so it seems more like a challenge to the existing structural repair rather than an established upward trend.
On the 15-minute chart, the price is also above EMA20, EMA50, and EMA200, and the moving averages are arranged in a mixed manner. This reinforces the current upward pressure, but it only represents the background at the execution level and cannot override the fact that there is no consistent arrangement on the daily chart.
Short-term momentum has strengthened, but confidence on the daily chart remains limited.
The confidence on the daily chart is still limited. The RSI value is at 50.7 and has been continuously declining in the last three readings; the MACD bar chart remains negative with no clear directional trend. Overall, although the real-time price is above the moving average, the confirmation at the daily chart level is still not high.
The hourly RSI is rising to 56.3, and the hourly MACD bar chart shows a positive trend, but the recent direction has been mixed. The market correction has indeed gained momentum support, however, this bar chart is not sufficient to indicate that the momentum is steadily increasing.
15-minute reading is even stronger: RSI has risen to 69.6, approaching the overbought area, and the positive MACD bar chart is expanding. This supports the current upward trend, but it also indicates that the short-term momentum is somewhat extended compared to the neutral daily chart.
The price is above the middle band of the daily Bollinger Bands at $1.76 and below the upper band at $1.88. It is also higher than the upper band of the hourly Bollinger Bands at $1.76 and the upper band of the 15-minute Bollinger Bands at $1.77. This contrast is in line with the characteristic of short-term movements expanding within a larger daily time frame, so both continuation and mean reversion are still possible.
The daily line ATR is at $0.1109, the hourly line ATR is at $0.02138, and the 15-minute line ATR is at $0.01359. Compared to these volatility readings, the distance from the daily line R1 is very small; therefore, it only touches the resistance level, which is not strong enough for the price to truly close above that resistance level.
The daily line R1 at $1.79 will break through, possibly separating from resistance.
If the daily close is above $1.79, a breakout will be confirmed; if it closes below $1.76, then the focus will shift to the support level around $1.73. The following scenarios define the trigger conditions and failure points.
Bullish scenario: If the daily close is above $1.79, which is the R1 level, it will confirm a breakout of the recent upper resistance, and the upper Bollinger Band level of $1.88 will become the focus of attention. If the subsequent daily close is below the middle band of $1.76, then this bullish scenario will not hold.
Bearish scenario: The trigger condition is for the daily close to fall below the middle band of the daily Bollinger Bands at 1.76 USD. The previous completed daily candlestick closed at 1.73 USD, which already meets this condition; this is not a pending confirmation of a break below. The current real-time rebound is challenging this bearish interpretation. If the rebound cannot be sustained, the daily EMA20 of 1.73 USD and the daily pivot point of 1.73 USD will become the next set of structural references. If the daily close is above the daily R1 of 1.79 USD, then this bearish scenario will be invalidated.
For in-trading testing, the level of $1.76 at R1 is lower than the current real-time price, so it now serves as a support reference rather than a resistance level above it. The previous completed hourly candlestick closed at $1.75, so breaking through that level is still part of the development of the real-time candlestick pattern. Further below, the hourly pivot point of $1.74 is another potential support level.
In this structure, the most likely false signal is a temporary break above the daily line R1 during the session, but it failed to hold its ground at the close of the daily session. The strong 15-minute momentum, the slightly bearish hourly moving averages, and the neutral daily structure are contradictory to each other, so it is not possible to determine with certainty which direction, continuation or decline, will occur.
Frequently Asked Questions
ATOM Is it already overbought?
No. The readings for RSI are as follows: 50.7 on the daily chart, 56.3 on the hourly chart, and 69.6 on the 15-minute chart. Only the shortest time frame is approaching the overbought area.
Does crossing above the moving average confirm a bullish trend?
In this snapshot, it is not possible to see that clearly. The price is above all three moving averages across different time periods, but the arrangement of the daily and 15-minute moving averages is mixed, while at the hourly level, the trend appears bearish.
This article was generated with the assistance of artificial intelligence and has been reviewed by an editorial team.
Algorand reached the daily line; R1 at $0.1237, but the closing price still needs to be confirmed.
Raydium The price needs to close above $2.53 per hour to confirm a breakout.
Curve DAO needs to close at $0.3957 per hour to continue its upward trend
Stay tuned to all the news about cryptocurrencies and the entire blockchain world.
Selected Videos
The ERC-8350 proxy memory registry of Ethereum records changes without exposing any data.
Cardano Price Forecast: ADA Testing at $0.30, bulls aiming for higher levels
Pok and mon's first Valentine's Day series will be released on January 27, 2027.
BTC to XMR: How to exchange Bitcoin for Monero without the need for KYC (2026 Guide)