On October 8, 2026, Algorand ( ALGO ) traded at $0.1255 in Binance, pushing the price of Algorand above its daily R1. However, the real-time price already precedes the evidence indicated by the completed candlesticks: the daily momentum is weakening, while the hourly moving averages remain bearish. This is a bullish pattern under pressure, but it is not yet a confirmed breakout.
Key Points
- ALGO reports $0.1255, which is higher than the daily average of $0.1237 for R1, but the last completed daily closing price was $0.1188.
- The daily chart EMA shows a bullish pattern (20 crossing above 50, 200 crossing above 50), but the bar chart for the daily chart MACD has turned negative.
- If the daily close exceeds $0.1237, a bullish pattern will be confirmed; if the hourly close falls below $0.1245, a bearish trend will be initiated.
- The trading volume of DEX on the Algorand chain is 346,133 US dollars, with varying trends across different time windows at various trading venues.
Algorand The price is strongly leading ahead of the confirmation of the completed candlestick pattern.
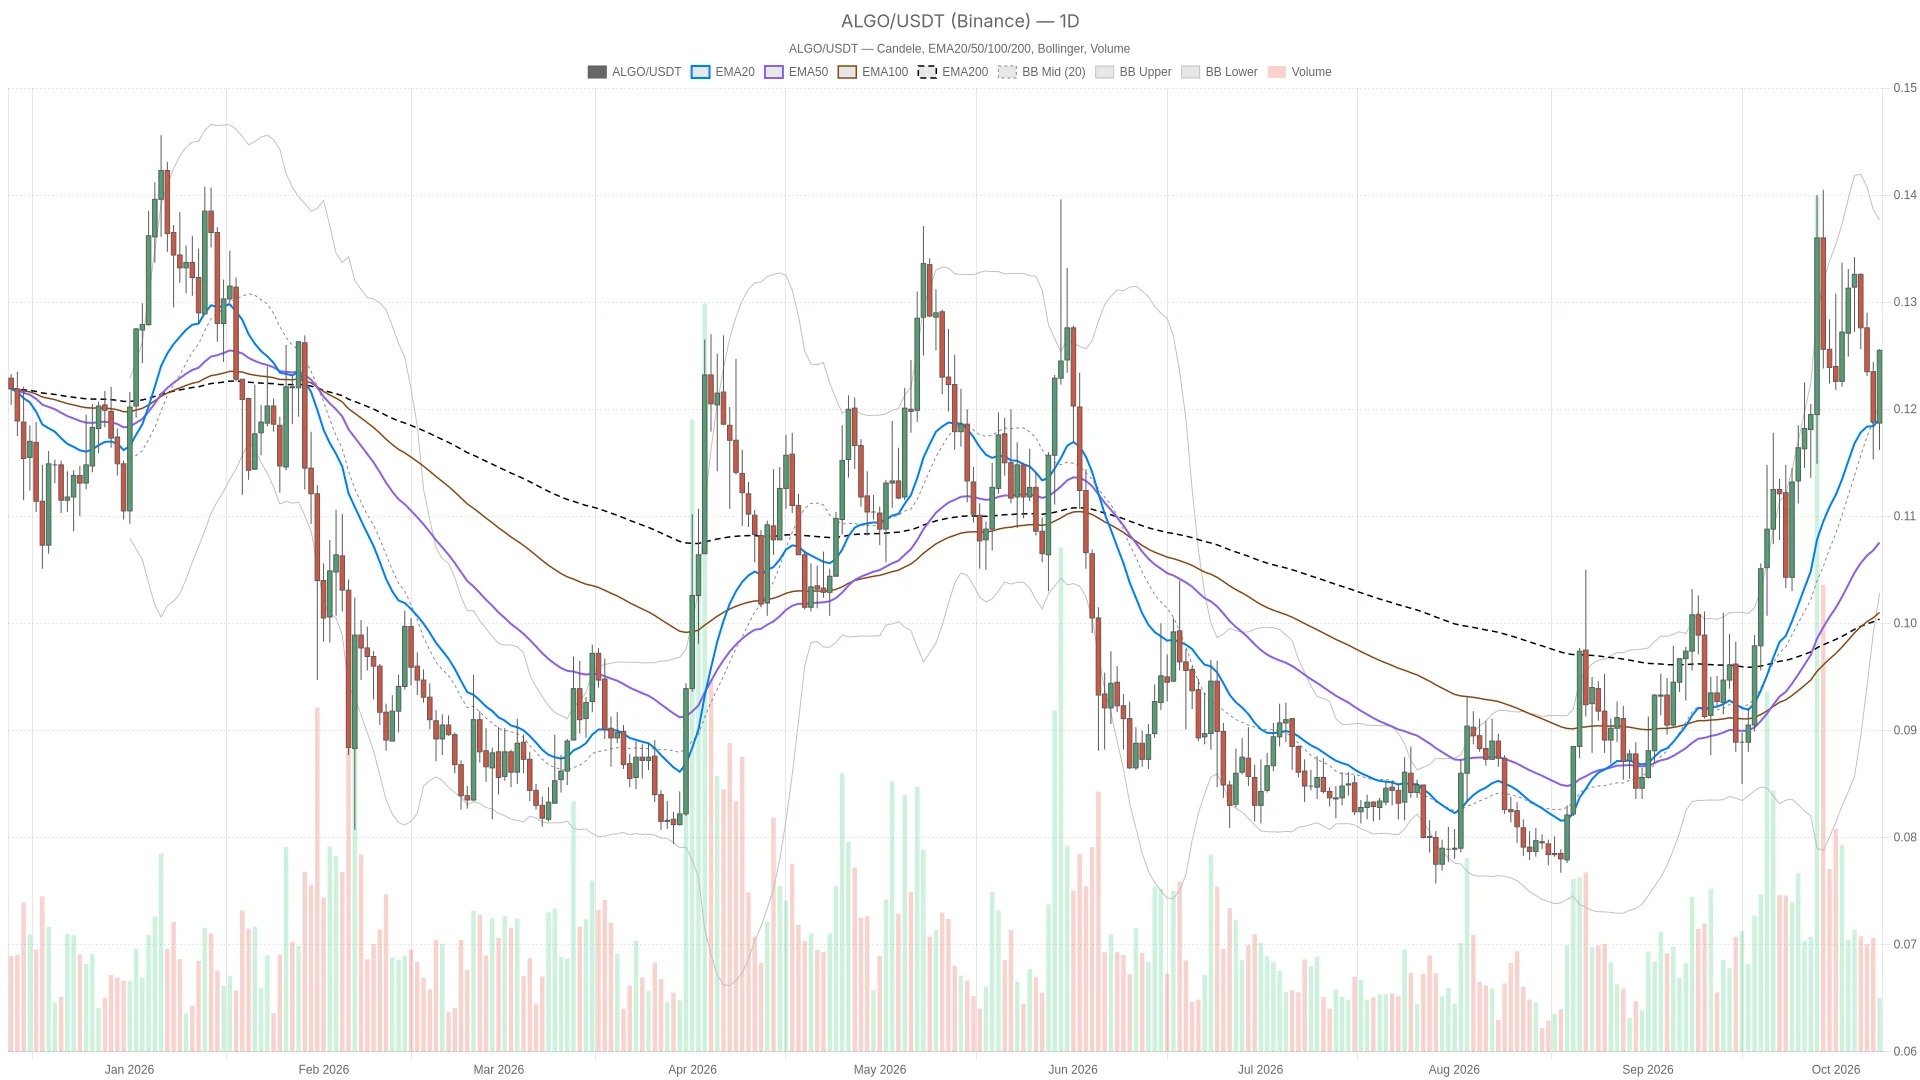
The current daily line real-time price is higher than the 20-day, 50-day, and 200-day EMA, and these moving averages are arranged in a bullish pattern. However, the last completed daily candle closed at $0.1188, which is lower than the $0.1237 of the daily line R1. The current trend has already broken through this level during trading, but a closing confirmation has not yet been formed.
The confirmation gap on the hourly chart is even more apparent: ALGO reports a price of $0.1253, while the last completed hourly closing price was $0.1181. The real-time price is higher than the three hourly EMA levels, but their overall trend remains bearish. The 15-minute chart shows a price of $0.1259, with the last completed closing price at $0.1239, which further reflects this upward movement. What is presented here are real-time candlestick readings for different time periods and should not be confused with closing prices.
Bullish daily structure meets short-term volatility stretch
On the daily chart, EMA20 is at $0.1184, which is higher than EMA50 at $0.1068 and EMA200 at $0.1001. The price is above all these moving averages, providing a solid structural foundation for a longer-term trend. On the hourly chart, the price is also above EMA20 at $0.1184, EMA50 at $0.1207, and EMA200 at $0.1245. However, the bearish arrangement of these moving averages indicates that the underlying structure has not yet been repaired by the recent rebound.
On the 15-minute chart, the price is above EMA20 at $0.1187, EMA50 at $0.1184, and EMA200 at $0.1208, but these moving averages do not form a consistent arrangement. Therefore, from an execution perspective, there is a strong presence, but there is no unified bullish trend across various time cycles.
The middle band of the daily Bollinger Bands is at $0.1189, between the lower band of $0.09907 and the upper band of $0.1386. The current real-time price is still within the range of the daily Bollinger Bands. In comparison, it is already above the upper band of $0.1196 on the hourly chart and the upper band of $0.1213 on the 15-minute chart. Compared to the shorter-term ranges, this fluctuation has extended, but there is still room for the price to move towards the upper boundary on the daily chart.
The daily ATR is at $0.008753, the hourly ATR is at $0.001280, and the 15-minute ATR is at $0.001153. These readings indicate that there may still be significant fluctuations during the trading session; a brief breakthrough above a certain nearby level is not as significant as a candlestick that can remain stable above that level after the close of trading.
RSI and MACD have different views on the sustainability of this rebound.
RSI Displays a relatively overheated execution window, rather than widespread confirmation.

The daily RSI is at 53.6 and has shown a decline among the given completed readings. It is still above the median line, but this weakening direction reduces the persuasiveness of the bullish pattern. The hourly RSI is at 45.4, and the trend is classified as upward, so there can be a recovery observed, but the readings are still not above the median line. The 15-minute RSI is at 77.0 and continues to rise; it is indeed in an overbought state, which also serves as a reminder that chasing the latest impulse might be mistaken for confirmation of a larger trend.
MACD Distinguishing between long-term trends and short-term momentum
On the daily chart, the MACD bar chart has turned from positive to negative and continues to decline, indicating that the bullish EMA pattern has not been supported by daily momentum. On the hourly chart, the bar chart is positive but narrowing, while the MACD line remains negative. This is only a partial reversal and not a clear indication of momentum change. On the 15-minute chart, the bar chart has turned positive and continues to rise, supporting the current upward trend. The signals are contradictory: the momentum at the execution level is strong, but it is not as convincing at higher time frames.
The daily line R1 confirms the scenario defined by the hourly line EMA200.
The most recent daily support level is $0.1237, which has already fallen below the current price. The daily pivot point of $0.1195 is the next reference level below that, while the upper band of the daily Bollinger Bands at $0.1386 represents a resistance level above the price. On the hourly chart, the most recent support level is $0.1245, followed by $0.1207. The hourly pivot point of $0.1179 serves as an even deeper support reference and is not equivalent to the daily pivot point.
Bullish scenario: If the daily close exceeds the $0.1237 level, it will confirm a real-time recovery and increase the likelihood of extending to the upper band of the daily Bollinger Bands at $0.1386. However, this scenario is still to be confirmed, as the last completed daily close was still below that level. If subsequent daily closes fall below the $0.1195 daily pivot point, then this continuation pattern will become invalid. The most likely false signal would be a temporary breakout above the $0.1237 level during trading hours, but failing to hold that level at the time of the daily close, especially when short-term momentum has already been stretched.
Bearish scenario: The trigger condition is when the hourly close falls below $0.1245, which opens the perspective for mean reversion, pointing towards an hourly level of $0.1207. The last completed hourly candlestick has already met this threshold; it cannot be considered a new, pending confirmation of a break below this level. Since the real-time price has since returned above that level, this bearish signal is currently under challenge and not clearly confirmed. If the hourly close once again rises above $0.1245, then this bearish scenario becomes invalid. A major false signal arises when earlier occurrences of "closing below the moving average" are taken as decisive evidence, while the subsequent real-time recovery above that level is ignored.
The trading volume of Algorand continues to show divergence beyond the intraday growth.
The trading volume of DEX on the Algorand blockchain amounted to 346,133 US dollars within 24 hours. This refers to the transaction activity on the blockchain, and not limited to the trading volume, fees, or revenue of ALGO.
The trading volume of Pact increased by 96.17% within a single day, but it saw declines of 46.49% and 58.73% over a 7-day and 30-day period, respectively. Tinyman rose by 34.44% in one day, then declined by 32.4% after 7 days, and increased by 1.52% after 30 days. Looking at a longer time frame, the performance of various trading venues varied; a single-day increase is not sufficient to prove that there is sustained activity supporting this round of price increases.
Greed is accompanied by a market landscape dominated by Bitcoin.
The Fear & Greed Index for Alternative.me is 64, which classifies it as greedy. CoinGecko shows that the total market value of cryptocurrencies is 2.83 trillion US dollars, with Bitcoin holding a dominant share of 58.77%. According to this classification, market sentiment leans towards risk appetite, but these overall market levels alone cannot verify a breakthrough for ALGO, nor can they determine the direction of change in Bitcoin's dominant share.
Frequently Asked Questions
Is the main scenario for ALGO bullish or bearish?
There are relatively many daily line structures, but there is a condition: the real-time price is higher than the bullishly arranged daily lines EMA. However, the completed candlestick daily lines RSI and MACD weaken this judgment.
Does the trading volume mentioned in the text, DEX, only count transactions of ALGO?
No. The data covers the trading volume of DEX on the Algorand blockchain, and is not limited to the transactions of ALGO.
This article was generated with the assistance of artificial intelligence and has been reviewed by an editorial team.