The daily chart pattern of Pacira BioSciences is predominantly bullish, but the overbought readings make it important to distinguish between trend support and immediate price support. The hourly chart confirms this daily bias; at the same time, the 15-minute chart places the current decision-making area near its pivot point.
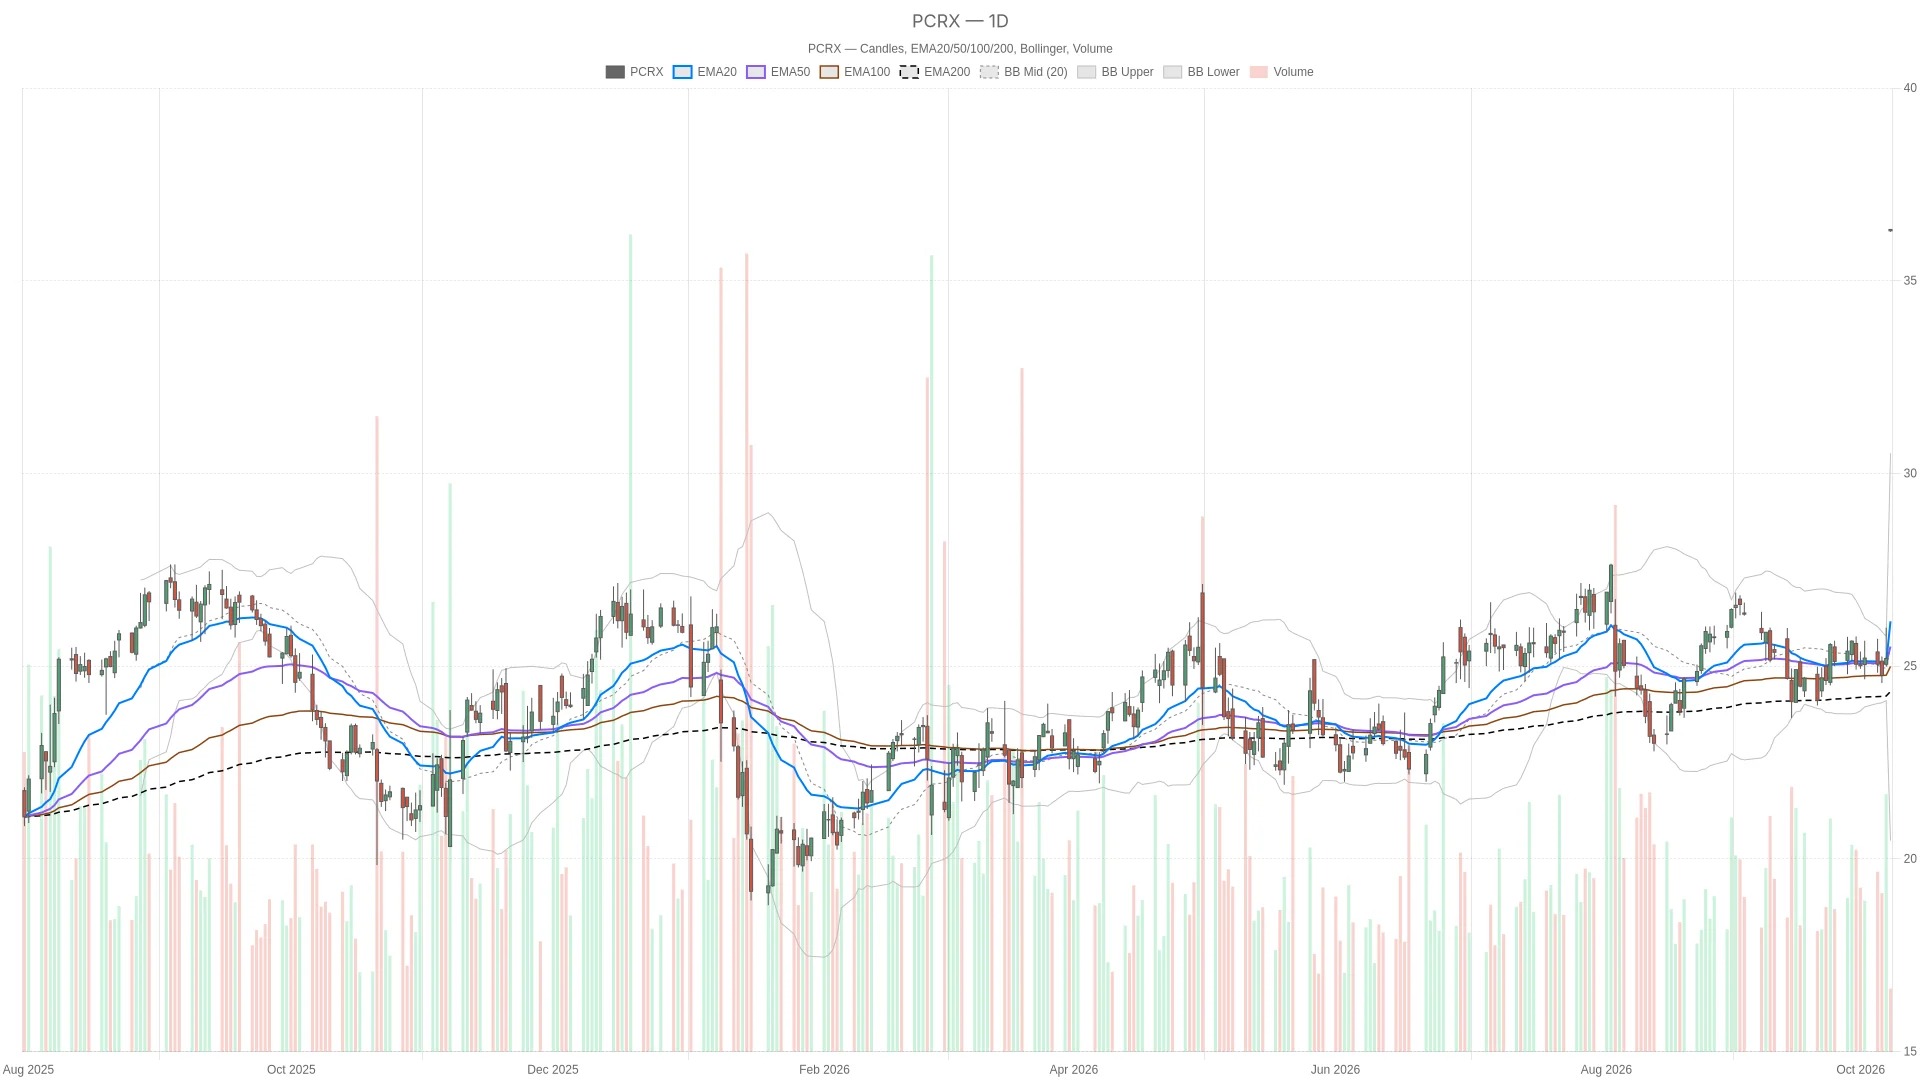
On Thursday, October 8, 2026, PCRX opened at $36.33 and fluctuated between $36.27 and $36.33 during the session. As of 10:05 AM Eastern Time, the stock was trading at $36.295, up 44.03% from the previous day's closing price of $25.20, with a trading volume of 196,145 shares at that time. The current trading session has not yet ended. The daily candlestick chart showed an opening price of $36.33, a low of $36.27 during the session, a high of $36.33, and the latest price is $36.30, compared to the previous closing price of $25.20.
Key Points
- The daily line RSI14 is at 84.98, higher than 50.91 from the previous trading day; the hourly line RSI14 is at 90.74; the 15-minute line RSI14 is at 94.38, all of which are in overbought territories.
- The price is above the 20-day EMA level of $26.16, the 50-day EMA level of $25.51, and the 200-day EMA level of $24.46, maintaining a bullish arrangement.
- The daily line MACD is at 0.87, which is higher than the signal line of 0.14, and the bar chart shows a positive value of 0.72.
- The price is below the 15-minute chart pivot point of $36.3 and the first resistance level of $36.31, but above the first support level of $36.29, forming the current decision-making area.
Before the trading session on Thursday, there were messages regarding Pacira BioSciences.
According to a report by Yahoo Finance on October 6th, Pacira has signed a cooperation agreement with Molteni Farmaceutici of Italy. The report states that Molteni has obtained the exclusive distribution rights for EXPAREL; EXPAREL is a non-opioid postoperative analgesic developed by Pacira and is available in multiple European countries. Investing.com also reported on this European expansion cooperation on October 5, 2026. All of the above reports were published before the trading hours on Thursday.
There is relatively strong support in the daily trend; the daily RSI14 level is 84.98.

The daily moving averages of PCRX are arranged in a bullish manner below the price: the 20-day moving average is EMA at $26.16, the 50-day moving average is EMA at $25.51, and the 200-day moving average is EMA at $24.46. This sequence supports a major bullish bias. However, the price is also above the upper band of the daily Bollinger Bands at $30.52, indicating that it is operating outside of the current range.
On the daily chart, RSI14 rose from 50.91 on the previous trading day to 84.98, entering an overbought zone. These readings support a bullish outlook, but RSI only indicates overbought conditions and does not in itself constitute a bearish signal.
Meanwhile, on the daily chart, ATR14 has risen from $0.83 to $1.56, indicating higher volatility compared to the previous trading day. The price is above the first resistance level of $25.8, the pivot point of $25.4, and the first support level of $24.79. These levels are derived from the previous completed daily candlestick chart and are applicable to the current trading session, but they all lie below the current real-time trading range.
Confirm the timing on the hourly chart with that on the 15-minute chart.
Hourly chart indicates a strengthened bullish bias.
At the same time, the hourly chart of PCRX confirms the daily view. The price is above the 20-hour EMA at $26.24, the 50-hour EMA at $25.57, and the 200-hour EMA at $25.13, which are all positioned higher on the hourly chart. The hourly RSI14 is at 90.74, also in an overbought zone. The MACD line is at 0.94, which is 0.2 above the signal line, and the bar chart shows a positive value of 0.74. The price is also above the upper band of the Bollinger Bands on the hourly chart at $30.57, as well as the pivot point of $25.18 on the hourly chart. There is no divergence in direction here, but the hourly readings further reinforce the overbought indication.
15-minute chart defines the immediate decision-making area
From a short-term execution perspective, the price is below the pivot point of 36.3 USD and the first resistance level of 36.31 USD on the 15-minute chart, but above the first support level of 36.29 USD. It is also above the upper band of the Bollinger Bands on the 15-minute chart at 34.84 USD, as well as the 20-quarter-hour level of 28.19 USD. The 15-minute RSI (Relative Strength Index) is 94.38, which indicates an overbought area, while the Stochastic Oscillator (RSI) reading is 1.25, which is positive. Compared to the daily chart, the 15-minute RSI has dropped from 0.89 USD to 0.82 USD. This comparison describes local volatility rather than a shift in the long-term trend of the daily chart.
Bullish and bearish conditions
The bullish scenario requires holding the first support level of $36.29 on the 15-minute chart, followed by breaking through the pivot point of $36.3 and the first resistance level of $36.31. If it further breaks above the high of $36.33 from this trading session, that will further support this judgment. The moving average structures on the daily and hourly charts still serve as its broader technical foundation.
On the contrary, if it falls below $36.29 and further loses support at the low of $36.27 from this trading session, that would weaken the current bullish outlook. If it continues to decline, the upper band of the 15-minute chart at $34.84 would provide another reference level; followed by the upper band of the hourly chart at $30.57 and the upper band of the daily Bollinger Bands at $30.52. Such a weakening trend would not automatically reverse the daily bias. If it breaks below the 20-day moving average of $26.16, that would more directly challenge the broader structural trend.
Overall, PCRX is located between the support level and the pivot point on the 15-minute chart, while still above the daily trend line and the upper band of the daily Bollinger Bands. The volatility measured on the daily chart has increased, and RSI over three time cycles is in an overbought state. The issue that remains to be resolved is whether the nearby support level can hold during the current trading session, which has not yet ended.
Frequently Asked Questions
PCRX What key technical aspects need attention?
The 15-minute chart's first support level at $36.29, pivot point at $36.3, and first resistance level at $36.31 form an immediate decision-making area. The high of this trading session at $36.33 serves as a reference for upward movement in the vicinity. Below that are the upper band of the 15-minute chart at $34.84, the upper band of the hourly chart at $30.57, and the upper band of the daily Bollinger Bands at $30.52. The 20-day moving average on the daily chart at $26.16 ($EMA) represents a broader trend foundation.
PCRX Is it overbought?
Yes, all three time frames are in overbought conditions. The daily line RSI14 is at 84.98, which is higher than 50.91 from the previous trading day; the hourly line RSI14 is at 90.74; and the 15-minute line RSI14 is at 94.38. Nevertheless, being overbought in RSI does not necessarily mean that a bearish reversal will occur.
What does the moving average trend for PCRX indicate?
The daily moving averages are in a bullish arrangement: the 20-day moving average of EMA at $26.16 is higher than the 50-day moving average of EMA at $25.51, which in turn is higher than the 200-day moving average of EMA at $24.46. The price of $36.295 is above all three moving averages, confirming a bullish daily trend. The hourly chart EMA also shows the same bullish arrangement.
What reports are there regarding the acquisition/cooperation of Pacira BioSciences?
Cryptonomist and the author do not hold any positions in the financial instruments mentioned in this text, nor have they received any compensation from the companies reported.
This article was generated with the assistance of artificial intelligence and has been reviewed by an editorial team.
Pfizer's stock price is reported at $27.75, down 0.89%, below its pivot point of $27.91.
iPower rose 25.96% in the market, but still remains below its daily level of $1.39. EMA
Flye Group Stock rose 120.47% during trading, and on the daily chart, it reached RSI at 75.56
Get the latest news on all cryptocurrencies and the entire blockchain world.
Selected Videos
The U.S. government made an encrypted transfer of over $100 million, but the sale has not yet been confirmed.
Cardano remains at $0.2724, the hourly chart RSI issues an overbought warning
Lido EarnUSD The handling fee has been reduced to 0.2%, and the performance commission has been increased to 15%.
The ERC-8350 proxy memory registry of Ethereum records changes without exposing any data.