

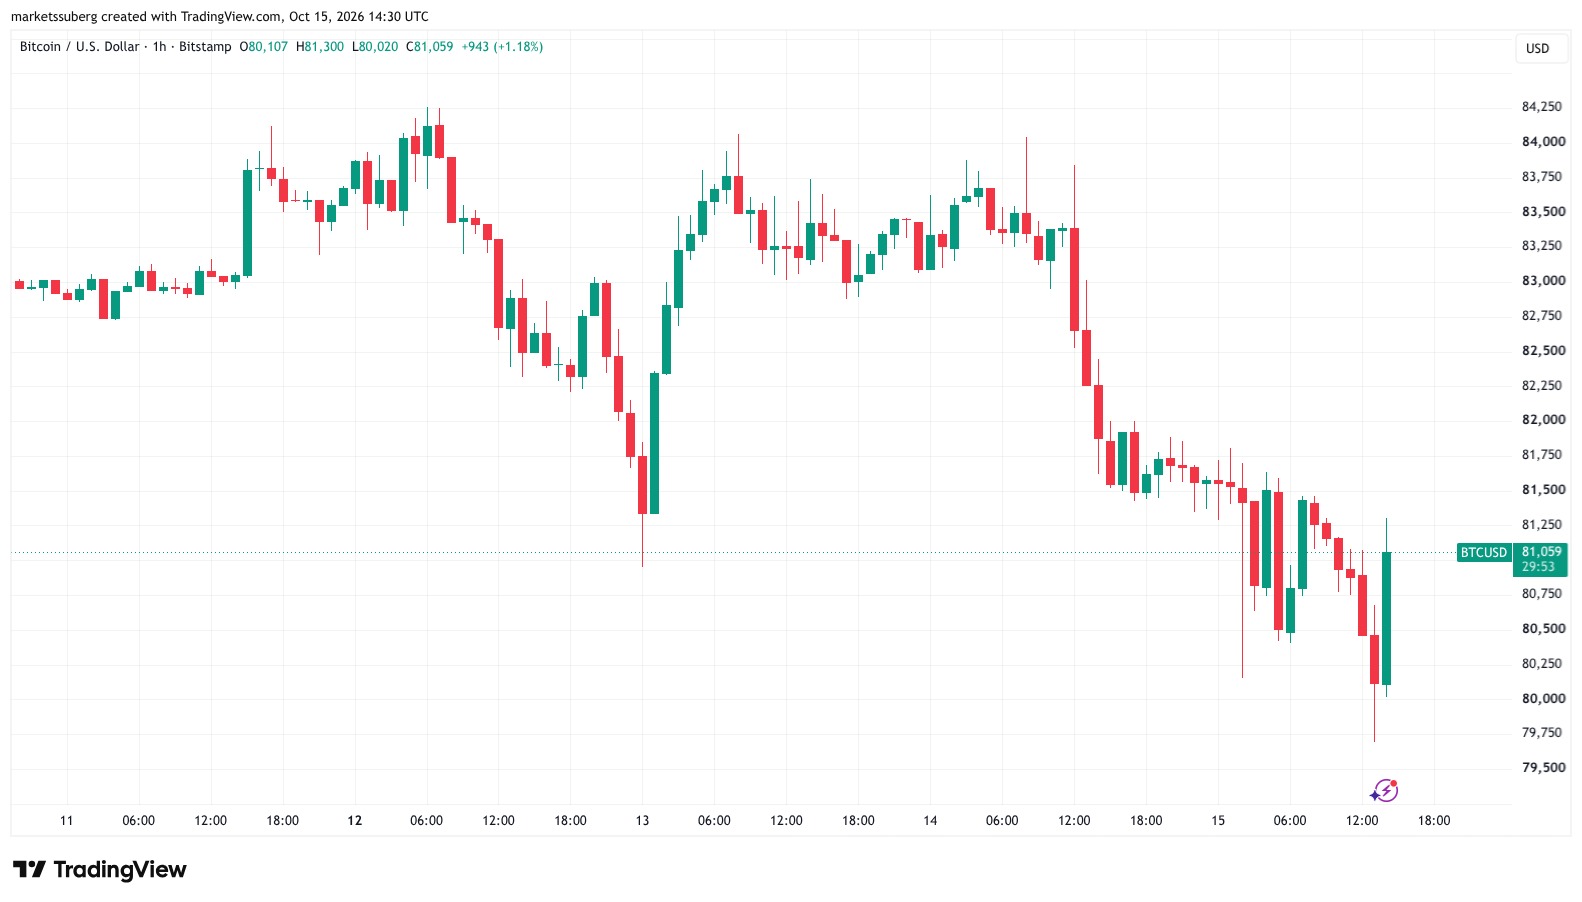
After the U.S. Producer Price Index ( PPI ) in September significantly exceeded expectations, Bitcoin ( BTC ) fell below $80,000 on Thursday.
Key points:
- Affected by the US PPI inflation data, which was 100 basis points higher than expected, Bitcoin once fell below $80,000.
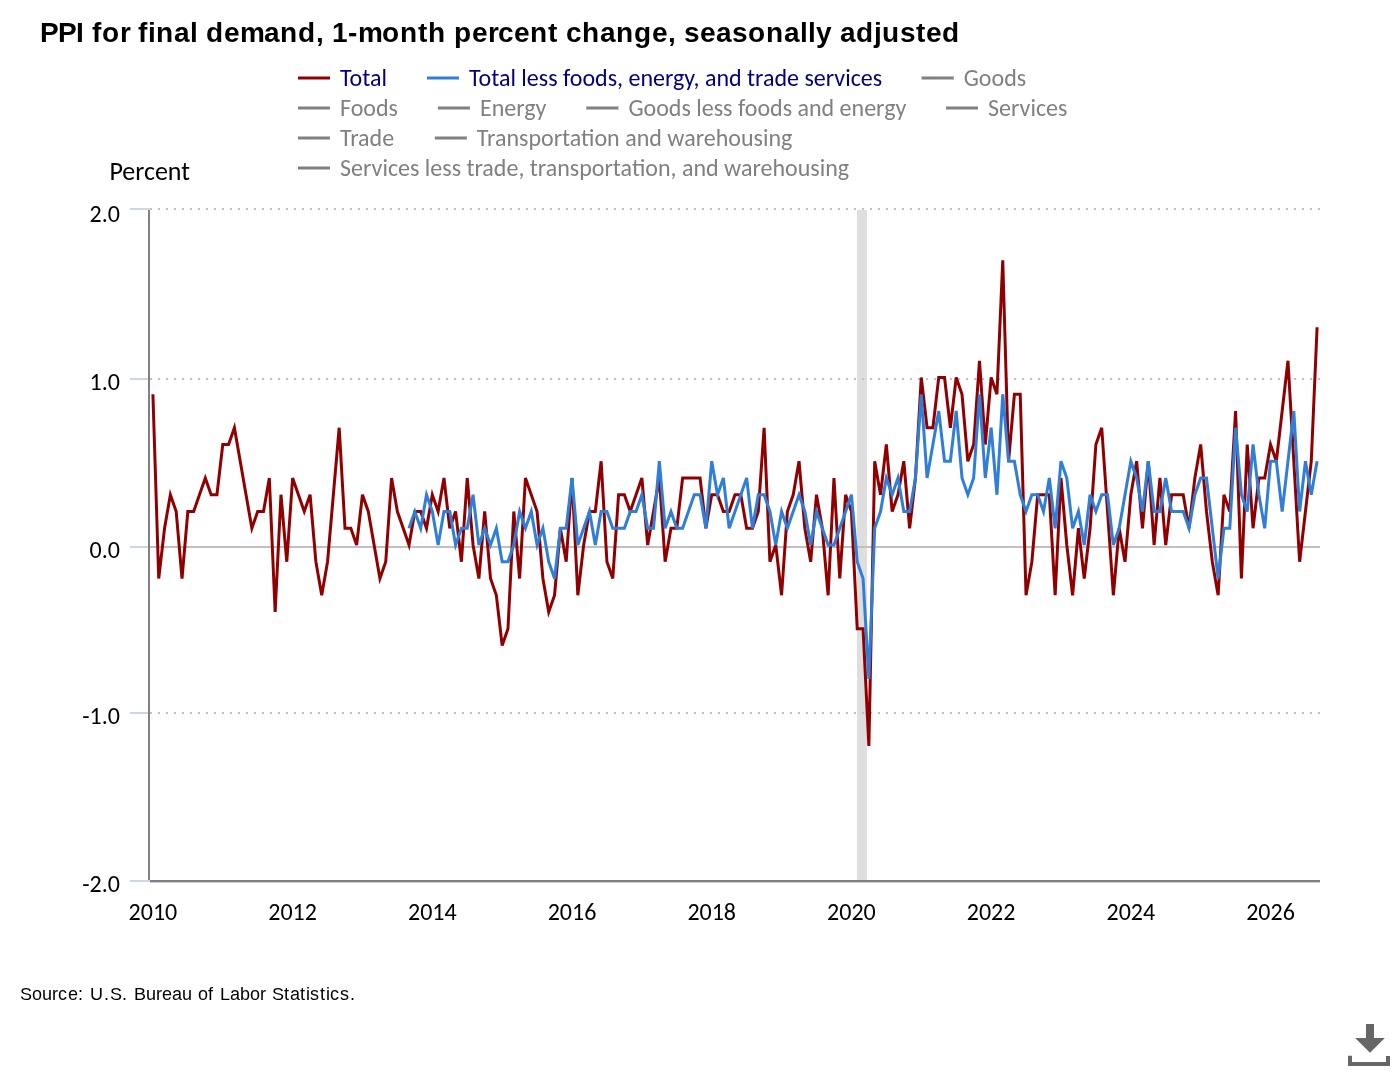
- In September, the PPI was 6.3%, higher than the market's expectation of 5.3%, marking the largest single-month increase since March 2022.
- Bitcoin price analysis suggests that there may be a 'volatility backtest' of the trend line around $78,000 in the coming period.
The largest PPI increase since March 2022, adding macroeconomic variables to Bitcoin
Data from TradingView shows that BTC / USD fell to their lowest levels since September 18th, with a maximum intraday decline of 1.8%, before rebounding to around $81,000.
According to data from the U.S. Bureau of Labor Statistics ( BLS ), in September, the PPI was 6.3%, which is exactly 100 basis points higher than expected; the core PPI rose to 5%, compared to an expected 4.4%.
An official press release confirmed: "The increase in September was the largest since a 1.7% rise in March 2022. On an unseasonally adjusted basis, over the 12 months to September, the final demand index rose by 6.3%, marking the largest 12-month increase since a 6.4% rise in December 2022."
One day before the release of this set of data, the U.S. Consumer Price Index ( CPI ) also exceeded expectations, leading to a decline in cryptocurrencies and risk assets. Risk assets were already under pressure due to selling off in technology stocks centered around South Korea; the South Korean Composite Stock Price Index ( KOSPI ) fell by 7.5% on Thursday.
Economist Mohamed El-Elian ( Mohamed El - Erian ) described the PPI data as "even more notable" than the CPI results. El-Elian and others pointed out that despite rising inflation data, U.S. Treasury yields did not increase accordingly. At the time of writing, the yield on 10-year U.S. Treasury bonds fell by nearly 3%, reaching its lowest level since September 23.
Robin Brooks, former chief foreign exchange strategist at Goldman Sachs ( Robin Brooks ), reiterated her previous judgment that as market attention shifts to how the government will handle the federal budget deficit, yields have become "decoupled" from U.S. macro data.
Brooks compared the 30-day correlation between “data uplink anomalies” and the daily fluctuations in the yield of 10-year U.S. Treasury bonds, stating that this correlation had dropped from near 0.6 in early 2026 to slightly below zero by the end of August.
In a blog post last month, he summarized: “This indicates that yields have become decoupled from the data, and the obvious explanation is that the market is more concerned with the trend of deficits; therefore, regardless of any unexpected data, they are pushing up long-term yields.”
Analysis of support levels during the early stages of a bull market: backtesting
At the same time, the price trend of Bitcoin has once again brought two support trend lines into focus: the 21-week and 50-week exponential moving averages ( EMA ), which are located at $76,144 and $78,459 respectively.
Trader and analyst Rekt Capital pointed out that BTC / USD may still backtest these two moving averages, while maintaining an overall bullish trend.
Rekt Capital posted on platform X, stating: 'In volatility backtesting, prices have fallen below these levels in search of a callback bottom, a situation that has occurred in the early stages of bull markets in history. However, such deviations usually occur after these two EMA form a bullish crossover, and Bitcoin is currently still in the stage before that crossover.'
Bitcoin is still below the range of $82,500 to $82,800. Over the past few weeks, this area has been a key support level of concern.
Aksel Kibar indicates: 'If the weekly chart closes within this range, it is possible to resume a wide consolidation between $60,000 and $82,800; $75,000 could serve as a failure point for this pattern (reversal at the bottom of the rectangle).'