Preliminary data released by the European Statistical Office on October 16 indicated that the eurozone had a trade deficit of 16.1 billion euros with goods from outside the region in August. Last year at the same time, the deficit was only 1.7 billion euros, and in July of this year, there was even a surplus of 10.7 billion euros. Just looking at the direction, the shift from surplus to deficit is quite noticeable; however, this figure is influenced by seasonal factors, prices, and product structure, and it cannot be directly interpreted as a loss of competitiveness for the eurozone economy. The European Statistical Office also provides unseasonally adjusted and seasonally adjusted series of data, which are suitable for different types of analysis. Mixing the two can lead to misinterpretations.
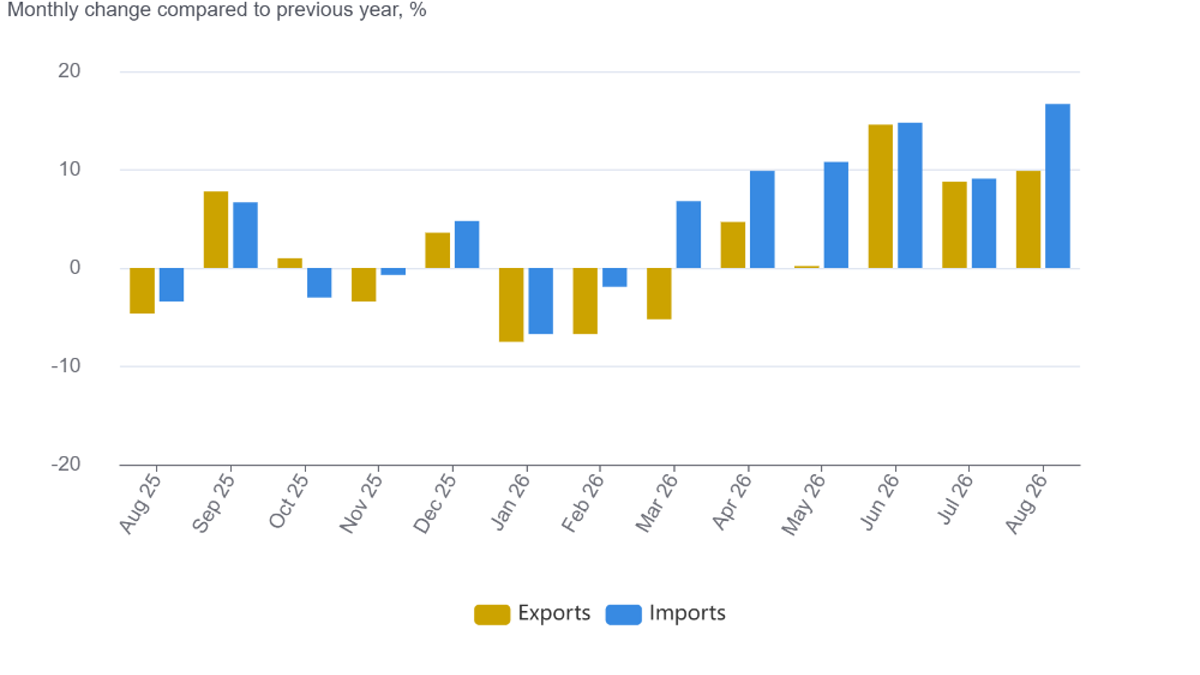
In unseasonally adjusted terms, in August, the eurozone's exports to outside the region amounted to 227.7 billion euros, a year-on-year increase of 9.9%; imports totaled 243.8 billion euros, a year-on-year increase of 16.7%. This indicates that exports did not shrink year-on-year, but rather imports expanded more rapidly, pushing the trade balance into negative territory. When examining the reasons, it is necessary to consider changes in energy, machinery, and vehicles, as well as volume and prices, rather than just focusing on the final balance. The European Union Statistics Office has made it clear that these are preliminary estimates, and data from member states may be updated later on, which is also a limitation that should be taken into account when interpreting the results.
The trade deficit has expanded, mainly in the sectors of mechanical vehicles and energy.
Official group data shows that the trade balance for machinery and vehicles shifted from a surplus of 7.2 billion euros in August last year to a deficit of 700 million euros in August this year; the deficit for energy products expanded from 21.3 billion euros to 26.7 billion euros. Although these two categories of products show opposite trends, they both contributed to the overall trade gap. The changes in machinery and vehicles are related to the supply and demand in European manufacturing, cross-border procurement, and timing of deliveries; energy products, on the other hand, are more susceptible to international prices and import volumes. The statistical office announced the total trade volume but did not directly prove in this brief that any single factor dominated all of these changes.
If we look at the first eight months of this year, the eurozone's cumulative trade in goods with regions outside the eurozone has shifted from a surplus of 90.9 billion euros in the same period last year to a deficit of 5.4 billion euros. During this time, exports grew by 2.1%, while imports increased by 7.3%. This data indicates that the pressure on the import side is not limited to August, but it does not necessarily mean that there will be a deficit throughout the year. Exchange rates, energy prices, industrial investment, and holiday schedules can all change the comparative basis for subsequent months. In addition to trade in goods, there is also trade in services, so readers should not equate these goods data directly with the complete current account.
Another easily confusing dimension is that of the eurozone versus the entire European Union. In August, the 27 countries of the EU had a trade deficit of 25.2 billion euros with goods from outside the region, compared to a deficit of 7.5 billion euros in the same month last year. Since the two regions have different boundaries, it is not appropriate to subtract the imports of one region from the exports of another. The statistical scope of the eurozone also included the new member Bulgaria in 2026, and year-over-year comparisons are made using an official chained method. When reporting these figures, it is much more accurate to specify the region and period, rather than simply referring to a “European trade deficit.”
Seasonally adjusted data reveal monthly trends, but they do not eliminate risks.
To observe changes between adjacent months, the European Statistical Office provides another set of figures that have been seasonally adjusted. According to this measure, in August, exports outside the eurozone decreased by 1.2% month-on-month, while imports increased by 2.0% month-on-month, resulting in a trade balance that shifted from a surplus of 1.4 billion euros in July to a deficit of 6.8 billion euros. The seasonally adjusted figure does not contradict the unadjusted deficit of 16.1 billion euros: the former eliminates common seasonal and calendar effects and is more suitable for monthly comparisons; the latter reflects the actual total statistics for that month and is more appropriate for comparison with the same month last year or with cumulative figures. The choice of measurement method must be guided by the specific question at hand.
The seasonally adjusted comparison over three months also provides a buffer. From June to August, exports outside the eurozone increased by 2.5% compared to the previous three months, and imports increased by 2.1%. Therefore, a single-month decline is not sufficient to declare a continuous decline in exports. For foreign trade companies, the fulfillment of orders, shipping timing, and inventory management may concentrate the flow of goods across different months; for policy discussions, it is more important to observe whether there will be a sustainable improvement in machinery products, energy, and other manufactured goods in the coming months.
The implications of a trade deficit for financial markets are not straightforward. If it is driven by rising costs of imported energy, it may put pressure on both corporate profits and consumer prices; if it results from increased imports of equipment by businesses, a short-term deterioration in the balance may also correspond to future investments in production capacity. The effects of these two scenarios on exchange rates, bonds, and industries are distinctly different. The current statistics provide classifications and amounts of goods, but not the purposes of corporate investments or the ultimate transmission of prices. To directly use the trade balance as a predictor of economic growth, more evidence is needed.
For the general public, the most cautious conclusion is that in August, the eurozone experienced a significant trade deficit in goods, with imports growing faster than exports year-on-year. The weakening balance of machinery and vehicles and the expansion of the energy deficit are the main observations to note. However, these data are still preliminary figures, and the seasonally adjusted and unadjusted numbers cannot be interchanged. The next step will be to see whether revisions, energy prices, industrial output, and orders can explain these changes. By retaining the specific criteria, we can distinguish between a structural change that deserves attention and a single-month fluctuation that has been exaggerated by the headlines.
It is also necessary to distinguish between 'trade with non-eurozone countries' and 'internal transactions within the eurozone.' The deficit mentioned in this title refers to the balance of goods between the eurozone and economies outside the zone, not the net amount after transactions among the members of the eurozone. In August, the volume of goods trade within the eurozone increased by 9.2% year-on-year, indicating that transactions among members are still changing. However, internal trade flows cannot be used to offset the deficit with non-eurozone countries in terms of accounting. For multinational manufacturing companies, both market demand and supply chain arrangements are important, and they need to be tracked separately.
When analyzing the growth rate of imports, changes in amount cannot be directly equated with changes in the physical quantity of goods. Rising prices of energy and raw materials can increase the nominal import value even if the number of tons imported remains unchanged; changes in the prices of machinery and equipment, exchange rates, and product composition also affect year-on-year comparisons. A brief report from the European Union Statistics Office provides information on product group differences and trade volumes, but to determine how much additional goods Europe has actually absorbed, price indices and quantity series are also necessary. This step is particularly crucial for readers concerned about inflation or the competitiveness of the manufacturing industry.
Finally, at the policy level, it is not appropriate to regard a single-month deficit as a target that requires immediate intervention. The trade balance is the result of the combined effects of consumption, investment, energy dependence, exchange rates, and international supply. Improving it may come from increased exports, or it may result from a sudden shrinkage in import demand, which is not necessarily good news. More reliable criteria for judgment include whether corporate investment and productivity have improved, whether energy risks are controllable, and whether the actual purchasing power of residents remains stable. The data for August provides some clues to the issue, but the complete answer will have to be verified over subsequent months.
Source: Preliminary data on goods trade from Eurostat for October 16, 2026 https :// ec.europa.eu / eurostat / en / web / products-euro-indicators /w/6-16102026- bp.