

Bitcoin Price Outlook for November: Can There Be a Rebound After the Fed's Decision? BTC
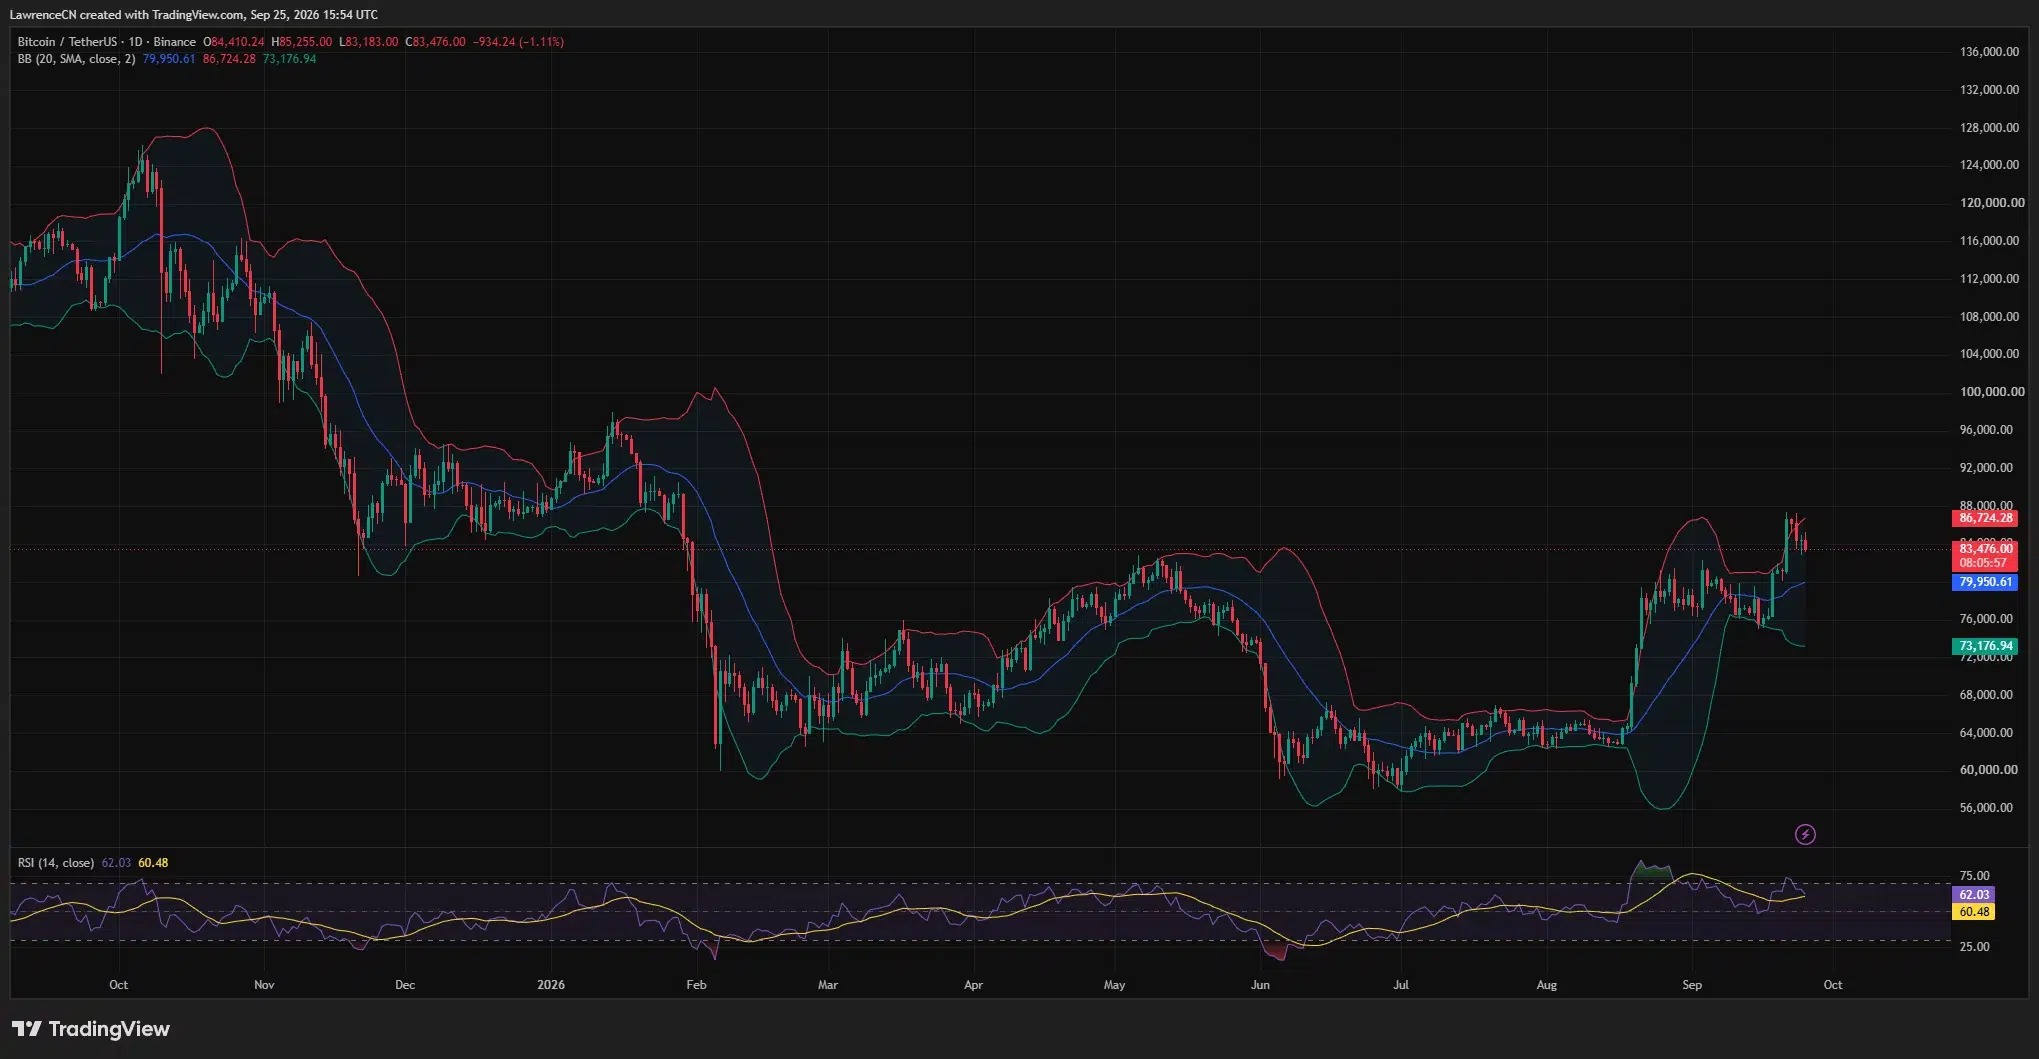
Bitcoin hovered around $82,000 in the last few weeks of October, having briefly fallen below $80,000 before that. The Federal Reserve's decision on October 28th, uneven demand for spot funds in the United States, and inflation data in November will all help determine whether this rebound can continue. To make predictions, it is necessary to consider both the conditions for an upward trend and those for a downward trend, rather than providing a single figure that is divorced from evidence.
- On October 17th, the trading price of Bitcoin approached $81,500, after having fallen below $80,000 at one point this week.
- U.S. inflation rate rose to 3.7% year-on-year in September, higher than 3.4% in August.
- According to the daily data from Farside, US spot Bitcoin funds experienced a total net outflow of $614.7 million over the first 12 trading days of October.
- The Federal Reserve will hold a meeting on October 27th to 28th, followed by the U.S. employment data on November 6th and inflation data on November 10th.
- A rise from $82,000 to $90,000 requires a 9.8% increase; a fall to $75,000 means a 8.5% decrease.
On October 17th, Bitcoin trading prices rebounded from below $80,000, which they fell to on Monday of this week, to around $81,500. CoinGlass Market data shows that in the past 24 hours since this article was written, the price decline was nearly 0.7%. Since real-time prices may change before publication, the following scenarios use $82,000 as a rounded reference point, rather than an exact assertion of the executable trading price for readers.
The Fed's schedule indicates that the next policy decision will be announced on October 28th. Inflation complicates this decision: The U.S. Bureau of Labor Statistics' Consumer Price Index (CPI) for September ( CPI ) showed an annual overall inflation rate of 3.7%. New employment and consumer price data will also be released in November, which will provide investors with clues to determine whether the October decision marks the beginning of a new round of tightening or is a separate action. Therefore, there are two timelines for price projections: market expectations before the meeting, and the signals conveyed by new data after the meeting.
Behind Bitcoin's rebound in October, the demand environment is not stable.
The starting point doesn't look as optimistic as the rebound itself might suggest. Bitcoin once fell below $80,000 before rebounding above $82,000 on October 16. In another price assessment on October 16, crypto.news mentioned that the market was near $81,400 and noted that the local highs were continuously moving lower. Breaking through a certain level during trading is different from maintaining buying interest over several consecutive trading days, especially when that same level serves both as support and resistance.
October's price fluctuations were accompanied by multiple contradictory signals. US spot Bitcoin funds recorded two positive trading days at the beginning of the month, followed by large redemptions on October 7th and 8th. On October 7th, there was a fund outflow of $484.9 million, which was the largest single-day outflow since June. On October 13th, there was a reinflow of $175.7 million, but on October 14th, another outflow of $261.4 million occurred. The daily fund table for Farside Investors shows a net outflow of $82.4 million on October 16th. The total amount for each day may be revised, and the net flow does not equate to the spot buying volume on that day in the exchanges.
Prices and capital flows are not necessarily synchronized. Bitcoin is traded around the clock, whereas the ETF indicators in the United States reflect the closing points of stock trading days. Buyers using overseas exchanges or derivative positions may drive prices upward while the assets of funds are decreasing. Authorized participants can acquire or deliver Bitcoin through subscription and redemption processes, which may not coincide exactly with the trading activities of a particular hour. To consider every price increase as evidence of a ETF buying rebound is to assume a causal relationship that cannot be proven with existing data.
The CPI report on October 14th added another layer of complexity at the macro level. In September, overall consumer prices rose by 0.6% month-on-month, and the indicator excluding food and energy increased by 0.3%. According to data from the Bureau of Labor Statistics, gasoline contributed more than half of the monthly increase in the overall index. Annual core inflation rose to 2.6%, lower than the overall figure of 3.7%, but higher than 2.4% in August. Readers who only look at the overall data may overlook the differences in the sources of inflation; those who only focus on core data may miss the pressure that energy prices exert on household spending and market interest rates.
After the release of CPI, Bitcoin fell back to around $81,900 on October 14. The report indicates that following the release of inflation data, the implied probability of a rate hike in October increased in the market, but these probabilities are merely changes in the prices of futures contracts and not the voting results of the Federal Reserve. They should be re-evaluated as the decision date approaches. Positioning around policy announcements can make what would otherwise be ordinary price fluctuations more intense when leveraged traders concentrate their bets in the same direction.
The Fed's decision is just the first stop on the November agenda.
On September 16, the Federal Open Market Committee raised the target interest rate by 25 basis points to 3.75% to 4%. The vote was unanimously approved. The next regular meeting is scheduled to end at 2 p.m. Eastern Time on October 28, followed by a press conference at 2:30 p.m. The October meeting is not one of those scheduled in the Fed's calendar for quarterly forecasts, so investors should not assume that a new dot plot will be released at that time.
The minutes of the September meeting, released on October 7, indicate that most participants felt it might be appropriate to raise interest rates once more before the end of the year, but they also emphasized that subsequent decisions would depend on new data. There are two more meetings left before the end of the year, in October and December. The minutes do not commit to an interest rate hike in October, and the forecasts made by the members in September were merely conditional judgments, not directives for future meetings. According to the Federal Reserve's forecast table, the median estimate for the policy rate at the end of 2026 in September was 4.1%.
Despite net outflows from the fund during the resolution period, Bitcoin still rose after the interest rate hike in September. Analysis of buying activity after the September hike found that subsequent demand for ETF and adjustments in derivatives jointly drove the trend, indicating that interest rate announcements alone cannot explain the entire market movement. Traders had already made arrangements in advance before the resolution; the same announcement could lead to either an increase or decrease in asset prices depending on what the market had already priced in beforehand and the chairman's statements regarding future policies.
The interest rate decisions, statements, and press conferences on October 28th should be interpreted separately. If there is a 25-basis-point interest rate hike, and at the same time the wording implies a pause, its meaning will not be the same as "expressing concerns about more persistent inflation after the hike." Even if interest rates remain unchanged, if officials hint that there will be another hike in December, it could still suppress Bitcoin. Market prices reflect expectations of changes in future policy paths, not just the label of a single decision.
Subsequently, the data for November will test the Federal Reserve's assessment of the economy. The Bureau of Labor Statistics' schedule for November indicates that the October employment report will be released on November 6th, October CPI will be released on November 10th, and October producer prices will be released on November 13th. Since October CPI is to be released after the Federal Reserve meeting, the committee cannot use this report when making decisions on October 28th, but it may still affect market expectations for the meeting on December 8th-9th. Due to possible changes in the government's schedule, the relevant data and release dates should be re-verified before they are published.
This sequence forms a conditional outlook. If inflation slows down and employment grows moderately after the October resolution, it may ease the pressure on bond yields; if inflation remains stubborn after the resolution, or if the labor market is significantly stronger than expected, it may support expectations for further tightening. Weak employment data is not necessarily favorable for Bitcoin; if it indicates a broader economic impact that prompts investors to shift to cash, the situation could be the opposite. No official data will directly predict the price of Bitcoin; what they affect are the interest rates and risk appetite environment in which Bitcoin exchanges operate.
12 ETF trading days are displayed. How much buying volume is needed for a rebound?
The most critical figures come from the accumulation of fund traffic, rather than large one-day outflows. The Farside US spot Bitcoin ETF table lists the daily totals for the first 12 trading days of October, in millions of US dollars: +102.7 million, +189.9 million, -89.8 million, +118.8 million, -484.9 million, -244.1 million, +21.1 million, -65.4 million, +175.7 million, -261.4 million, +5.1 million, -82.4 million. Adding these published figures together, the total net outflow as of October 16 is 614.7 million US dollars. This calculation uses one decimal place retained in the table; if the provider revises individual fund data later on, the result may vary slightly.
In the same 12 trading days, there was a total inflow of $613.3 million on positive trading days and a total outflow of $1.228 billion on negative trading days, both calculated using rounded figures. Therefore, the net outflow was primarily due to several large-scale selling days outweighing the buying volume, rather than the complete absence of positive trading days. On October 7th alone, it accounted for approximately 79% of the total net outflow, a ratio obtained by dividing $484.9 million by $614.7 million. This ratio describes the arithmetic concentration of the monthly total, not an estimation that one day's redemptions caused 79% of the price change in Bitcoin.
In the first 12 trading days, there were 4 days with a net inflow of over $100 million, and another 4 days with a net outflow of over $80 million. Small positive trading days cannot offset large negative trading days. For example, the $175.7 million inflow on October 13 was less than the $261.4 million outflow the following day; the combined net outflow for those two days was still $85.7 million. The $5.1 million inflow on October 15 also could hardly offset the $82.4 million outflow on October 16. These comparisons explain why a bar chart with alternating green and red bars may appear relatively balanced, but the monthly result is clearly negative.
This calculation addresses a more narrow question than some of the titles suggest. It does not tell us how many bitcoins were sold by the exchanges, which participants took over these supplies, or whether changes in fund holdings are completely consistent with the amount of capital flow. Net flow is merely an accounting estimate of capital inflows or outflows into listed products. The scale of asset management will fluctuate with the price of bitcoin. Even if the net flow is zero, trading volume could surge, as the transfer of shares among investors does not require the creation of new fund shares.
The initial imbalance provided an observable condition in November. To achieve a sustained rebound with the support of fund demand, it is necessary for multiple positive trading days of inflows to offset the previous outflows, rather than just returning to zero on one day. Based on the balance on October 16th, if there are no changes on other days thereafter, a single-day inflow of $1 billion would still result in a cumulative net outflow of about $515 million for October. To bring the total over the first 12 trading days back to equilibrium, subsequent trading days would need to see a combined net inflow of approximately $615 million. This figure is merely an arithmetic threshold on a monthly basis and is not a price threshold that Bitcoin must cross.
Even if the cash flow of ETF remains negative, direct spot buyers may take over on the other side; conversely, if the total amount of ETF turns positive, it may happen simultaneously with sales from long-term holding wallets, corporate treasuries, or miners. In an assessment of institutional demand in October, Bitget Wallet, the head of research Lacie Zhang, stated that institutional buying orders must absorb profit-taking and miner selling orders for the upward trend to be able to stabilize. Her view discusses the balance between buyers and sellers in different trading venues, rather than a certain ETF traffic target that can guarantee prices.
The price scenario starts from a reference point.
The scenario for November requires a clear starting point. This article uses $82,000 as a common reference point, which is close to the market price during the rebound on October 16th. Based on this, $85,000 is 3.7% higher than the reference price; $87,500 is 6.7% higher; $90,000 is 9.8% higher; and $95,000 is 15.9% higher. On the downside, $80,000 is 2.4% lower; $78,000 is 4.9% lower; and $75,000 is 8.5% lower. These percentages are calculated using $82,000 as the denominator and rounded to one decimal place. They represent arithmetic distances, not model probabilities, nor are they promised target levels.
Rebound scenario: $87,500 to $95,000Bitcoin first needs to retest the resistance level of $84,200 identified by traders in their chart analysis on October 16, before continuing to move above $80,000. This scenario would be supported if there is a sustained net inflow of ETF, increased participation in the spot market, and if interest rate expectations are not as aggressive after October 28. The upper boundary of this range represents a 15.9% increase from the reference price, which is a considerable movement within a month. However, if the capital flow indicated by ETF remains negative as prices rise, or if the information on October 28 and the CPI on November 10 drive up yields, this scenario would weaken.
Range scenario: $78,000 to $87,500If the buying pressure from funds returns intermittently but cannot be sustained, and Bitcoin may fluctuate between the downward range of October and the resistance area at the end of September, then such a scenario would be consistent with the current circumstances. This range is intentionally set: starting from $82,000, it encompasses both a 4.9% decline and a 6.7% increase. Referring to this as the baseline scenario does not imply assigning a certain probability to it; rather, it describes the possible path that prices might take when there is no clear indication from either buying momentum or policy signals.
Range: $75,000 to $78,000If the price falls below $80,000 and this persists across multiple daily closes, and at the same time ETF continues to redeem its positions and leveraged liquidations occur again, then lower price ranges will come into view. If the Federal Reserve signals further tightening measures, followed by stronger inflation figures, a downward trend becomes more likely. This range serves as an analytical boundary, not an assertion that a particular exchange necessarily has buy orders at $75,000. If the price breaks below the lower edge of this range, this limited scenario will no longer apply, and a re-analysis will be necessary, rather than arbitrarily expanding the target levels afterwards.
These ranges overlap at $78,000 and $87,500, as prices may trade near these boundaries without providing a reliable signal for the direction of the next month. Daily closes, participation levels, and changes in capital flows contain more information than brief touches of a certain price level during trading hours. If there is persistent selling pressure and the price fails to recover above $80,000, then the upward scenario becomes invalid; if there is continuous inflow and a clear breakthrough of resistance, then the downward scenario becomes invalid. New evidence could render either scenario invalid before November begins.
A cut in interest rates or a pause in such cuts does not necessarily mean that Bitcoin will rise.
The strongest argument in favor of a rebound is not just that the Federal Reserve may maintain interest rates unchanged. The increase in inflation in September was mainly driven by gasoline prices, while core prices have seen a slower rise throughout the year. If energy prices fall and the labor market weakens to a degree that limits further rate hikes but does not signal a recession, investors may lower their expectations for future interest rates. Capital flows have also reversed quickly before: after redemptions around the time of the September decision, demand returned in subsequent trading days. The market assessment after the rate hike suggests that the rebound is related to demand for spot funds, lower U.S. Treasury yields, weaker oil prices, and short covering. No single variable can explain the entire trend.
But there are also counterforces. The minutes of the September meeting show that most Federal Reserve participants expect another interest rate hike before the end of the year. The overall inflation rate in September was 3.7%, higher than 3.4% in August; core inflation also rose from 2.4% to 2.6%. If interest rate hikes are paused in October, it may simply be that officials are waiting for more data, rather than the end of the tightening cycle. In November, CPI is almost certain to reignite debates immediately. Bitcoin could rise during the expected pause, but if accompanying statements suggest that further hikes will follow, prices could still fall.
There are two effects of interest rate expectations that need to be considered separately. Higher yields on U.S. Treasury bonds will increase the attractiveness of interest-bearing assets relative to Bitcoin, which does not pay interest; however, the same yields will also reduce the overall market demand for speculative risky assets. Neither of these two paths will mechanically determine the price of Bitcoin. Liquidity, leverage, international buying, and events specific to the crypto industry could either offset or amplify these effects. If one only looks at the historical average returns before and after each Federal Reserve meeting, they will overlook what investors have already anticipated in advance of each event.
The requirements for ETF also involve a similar two-way logic. These products remain an important channel for American investors, and just a few large positive trading days can reverse the cumulative net outflow. However, the arithmetic results of October show that a single redemption is sufficient to outweigh multiple inflows. A strong flow of funds would improve the rebound scenario, but to consider it a sufficient condition would ignore the direct selling pressure from exchanges and the derivatives market. A weak flow of funds does not prove that there are no buyers elsewhere. The real disagreement lies in who the marginal buyers will be in November, rather than whether there are buyers at all in other places.
Leverage can change the path, but it does not determine the endpoint.
As of October 17th, according to CoinGlass, there were approximately $52.4 billion in outstanding Bitcoin futures contracts, and the amount settled in Bitcoin within 24 hours was around $77 million. These figures change rapidly, so it is advisable to refresh the data before viewing. Outstanding contracts represent the notional value of open positions and do not equate to the capital that can be settled in one go. Behind each futures contract are both long and short positions; an increase in the total amount alone does not indicate which party will win.
Combining the funding rate with open interest contracts provides a better way to observe the degree of congestion, but neither is a definitive indicator. A positive funding rate for perpetual contracts means that on platforms that adopt this mechanism, long positions typically pay fees to short positions. If there is a rise in prices accompanied by an increase in open interest contracts and a high funding rate, this trend may be more dependent on leveraged long positions; if prices rise while open interest contracts decrease, then some of the price increase may come from short positions covering their positions. At this point, spot trading volume and ETF cash flow can help determine whether new cash has replaced positions that were closed out.
The sell-offs in October demonstrated how forced liquidations can accelerate price volatility. When long positions are liquidated, exchanges will close those positions in accordance with margin rules, creating market-order sell orders in a downward-moving market. Subsequently, when short positions are covered, it may make the rebound seem strong before actual spot demand returns. None of these events alone can determine a fair value for Bitcoin. Derivative data helps to describe the trajectory and vulnerabilities of prices, while the spot market and capital flows are crucial for assessing whether the trend can be sustained.
The reason why integers such as $80,000 attract attention is partly because traders place orders and set stop-losses around these figures. There is no source that can prove that each time the price touches $80,000 it has equal significance; the clearing charts estimate the potential pressure that may arise from the positions that are exposed, rather than the commitments of individual traders. A brief drop below this level followed by a recovery should be treated differently from a situation where the price remains below it for several consecutive trading days. The same applies to breaking through $85,000: a sudden rise driven by futures does not carry as strong evidence as a continuous increase in price over several trading days, accompanied by inflows of funds and an increase in spot trading volume.
The Federal Reserve announced its results during U.S. market trading hours, while the underlying market for Bitcoin was still open throughout the day. The first closing data for ETF after the resolution will provide a clue, but the timing of release and the subscription mechanism may make attribution somewhat unclear. The employment data on November 6th and the CPI on November 10th were released before the U.S. market opened, so Bitcoin might react first during the night, whereas the share prices will only be updated when trading resumes. When describing causal relationships, it is important to compare the same time window and the same source of quotes.
There are important limitations to the scenario boundaries.
The time point being considered in this article is October 17th. The spot price of Bitcoin, policy expectations, ETF capital flows, and derivative positions may all experience significant changes before October 28th, not to mention by November 30th. If the price of Bitcoin at the beginning of November differs significantly from $82,000, then the scenarios constructed around this starting point will need to be recalculated. The percentage distances are based on precise arithmetic calculations from the selected reference points, but the chosen intervals reflect observed market areas and conditional judgments, rather than statistical confidence intervals.
Whether it's a decision by the Federal Reserve or a release from CPI, neither can provide a prediction for Bitcoin on its own. Monetary policy affects bond yields and the US dollar, but investors may have already factored in these changes in advance. The example in September showed that Bitcoin actually rose after interest rate hikes; the sell-off in October indicated that concerns about inflation were accompanied by capital outflows and deleveraging. If all price fluctuations are attributed to the latest macroeconomic news, then evidence at the trading level is overlooked.
ETF There are also reporting restrictions on the total amount. Different providers may have differences in coverage, fund cut-off points, and revisions. This article uses data from 12 US trading days provided in the Farside table; other trackers may provide slightly different monthly figures. The total trading volume, net investor capital flow, and changes in bitcoins held by funds answer different questions. None of these can directly identify the ultimate investors, counterparty sellers, or the specific moments when bitcoins were purchased.
The range of $75,000 to $95,000 mentioned in this article intentionally includes various outcomes, which does not imply that one of them is certain to occur. New geopolitical shocks, fund issuances, regulatory decisions, exchange disruptions, or corporate transactions could all cause the market to deviate from this range. Based on the evidence summarized in this article, it is not responsible to assign probabilities to these events. The next observable policy milestone is the Federal Reserve's statement on October 28th; according to the schedule of the Bureau of Labor Statistics, the next set of U.S. employment and inflation data will be released on November 6th and 10th, respectively.
What to Follow
- Federal Reserve statement and press conference on October 28: Comparing the interest rate decisions with the committee's wording regarding future rate hikes, held at 2 p.m. and 2:30 p.m. Eastern Time respectively.
- US spot Bitcoin ETF daily capital flow: Add data for November trading days to the Farside table, and distinguish between consecutive multiple-day inflows and single-day gains.
- Prices of $80,000 and $84,200: Pay attention to the daily closing price and trading participation, rather than just the intraday touches.
- Employment data for November 6th and CPI on November 10th: Compare the actual data with expectations, and observe the yield rates as well as Bitcoin's reaction.
- Unclosed futures contracts and funding rates: Check whether price changes are accompanied by new leveraged positions, short covering, or a decrease in congestion levels.
Frequently Asked Questions
What is the outlook for Bitcoin prices in November 2026?
Using $82,000 on October 17 as a reference, the conditional rebound range is from $87,500 to $95,000, the scenario within this range is from $78,000 to $87,500, and the downward scenario is from $75,000 to $78,000. None of the above are guaranteed targets, nor are they probability-weighted predictions.
When will the next Federal Reserve decision be made?
The Federal Open Market Committee will meet on October 27-28, 2026. A statement is scheduled to be released at 2 p.m. Eastern Time on October 28, followed by a press conference at 2:30 p.m.
Did the Federal Reserve raise interest rates in September 2026?
Yes. On September 16th, the Federal Reserve raised its target range by 25 basis points to 3.75% to 4%. Bitcoin then rose in value, but that does not necessarily prove that the interest rate hike was the reason for the increase.
How much did Bitcoin ETF lose at the beginning of October?
Adding up the total daily amounts of US spot funds from October 1st to October 16th, which were tracked by Farside Investors, there was a net outflow of approximately 614.7 million US dollars over the 12 trading days. This figure may change if the provider revises the table.
Why is the level of $80,000 important?
Bitcoin briefly fell below $80,000 during the sell-off in October before rebounding. If this level is repeatedly tested below, especially accompanied by capital outflows and long liquidations, the downward trend would be more convincing than a brief intraday drop.
Can Bitcoin reach $90,000 in November?
If the reference price of $82,000 adopted in this article were to rise to $90,000, it would require a increase of about 9.8%. Continuous demand from spot markets and funds, the recovery of resistance levels, and lower expected interest rates all contribute to a rebound scenario; however, none of these factors can guarantee that prices will definitely reach that level.
What U.S. data will be released after the Federal Reserve meeting in October?
The Bureau of Labor Statistics has scheduled the release of the October employment report for November 6th, the CPI for October to be released on November 10th, and the October producer prices to be released on November 13th. The relevant dates should be re-verified before publication.
Does the Fed's pause on raising interest rates in October mean that Bitcoin will rise?
No. Investors may have already factored in the possibility of a pause in advance, and maintaining the interest rate unchanged could also serve as a warning for subsequent rate hikes. ETF Capital flows, direct spot trading, and leverage will all affect the outcome. This article is for educational purposes only and does not constitute investment advice.