
















Key Points to Note
- Near Protocol ( NEAR ) returns to the valid range again
- Zcash ( ZEC ) is one of the leaders in the rebound.
- Dogecoin ( DOGE ) attempts to recover under low trading volume
- Ethereum ( ETH ) stabilizes at the support level
Key Points to Note
- Near Protocol ( NEAR ): NEAR traded at around $5.25, consolidated healthily below $6.00, with $5.60 being a key breakout level.
- Zcash ( ZEC ): ZEC traded at around $1,314, having recovered most of the losses from October; $1,380 is a key resistance level.
- Dogecoin ( DOGE ): DOGE traded at around $0.0825, attempting a rebound within a larger downward trend. It would be more meaningful if it could close above $0.0855.
- Ethereum ( ETH ): ETH is trading at around $2,482, which seems more stable than most major cryptocurrencies. $2,550 is the price level that would confirm the next upward move.
Near Protocol ( NEAR ) returns to the valid range again
NEAR is currently trading at around $5.25, closing with a positive candlestick on the daily chart and above the current range. This coin has always been one of the strongest performers in the market. It rose from around $1.60 in August to nearly $6.00 at the beginning of October, representing a gain of over 270%. After reaching its peak, the price fell back to $4.30 and has since been consolidating between $4.60 and $5.60. This is a healthy consolidation after such a rapid rise.
Importantly, NEAR has never fallen below the 20-day EMA; this moving average is currently at around $4.80 and serves as support during each pullback. Longer-term moving averages are significantly lower than the current price. The 50-day EMA is around $4.20, the 100-day EMA is around $3.40, and the 200-day EMA is around $2.75.
All of these moving averages are upward, and the distance between the price and the moving averages indicates how strong the trend is. RSI is currently close to 55, which is a significant decline from the overbought level of over 80 at the end of September.
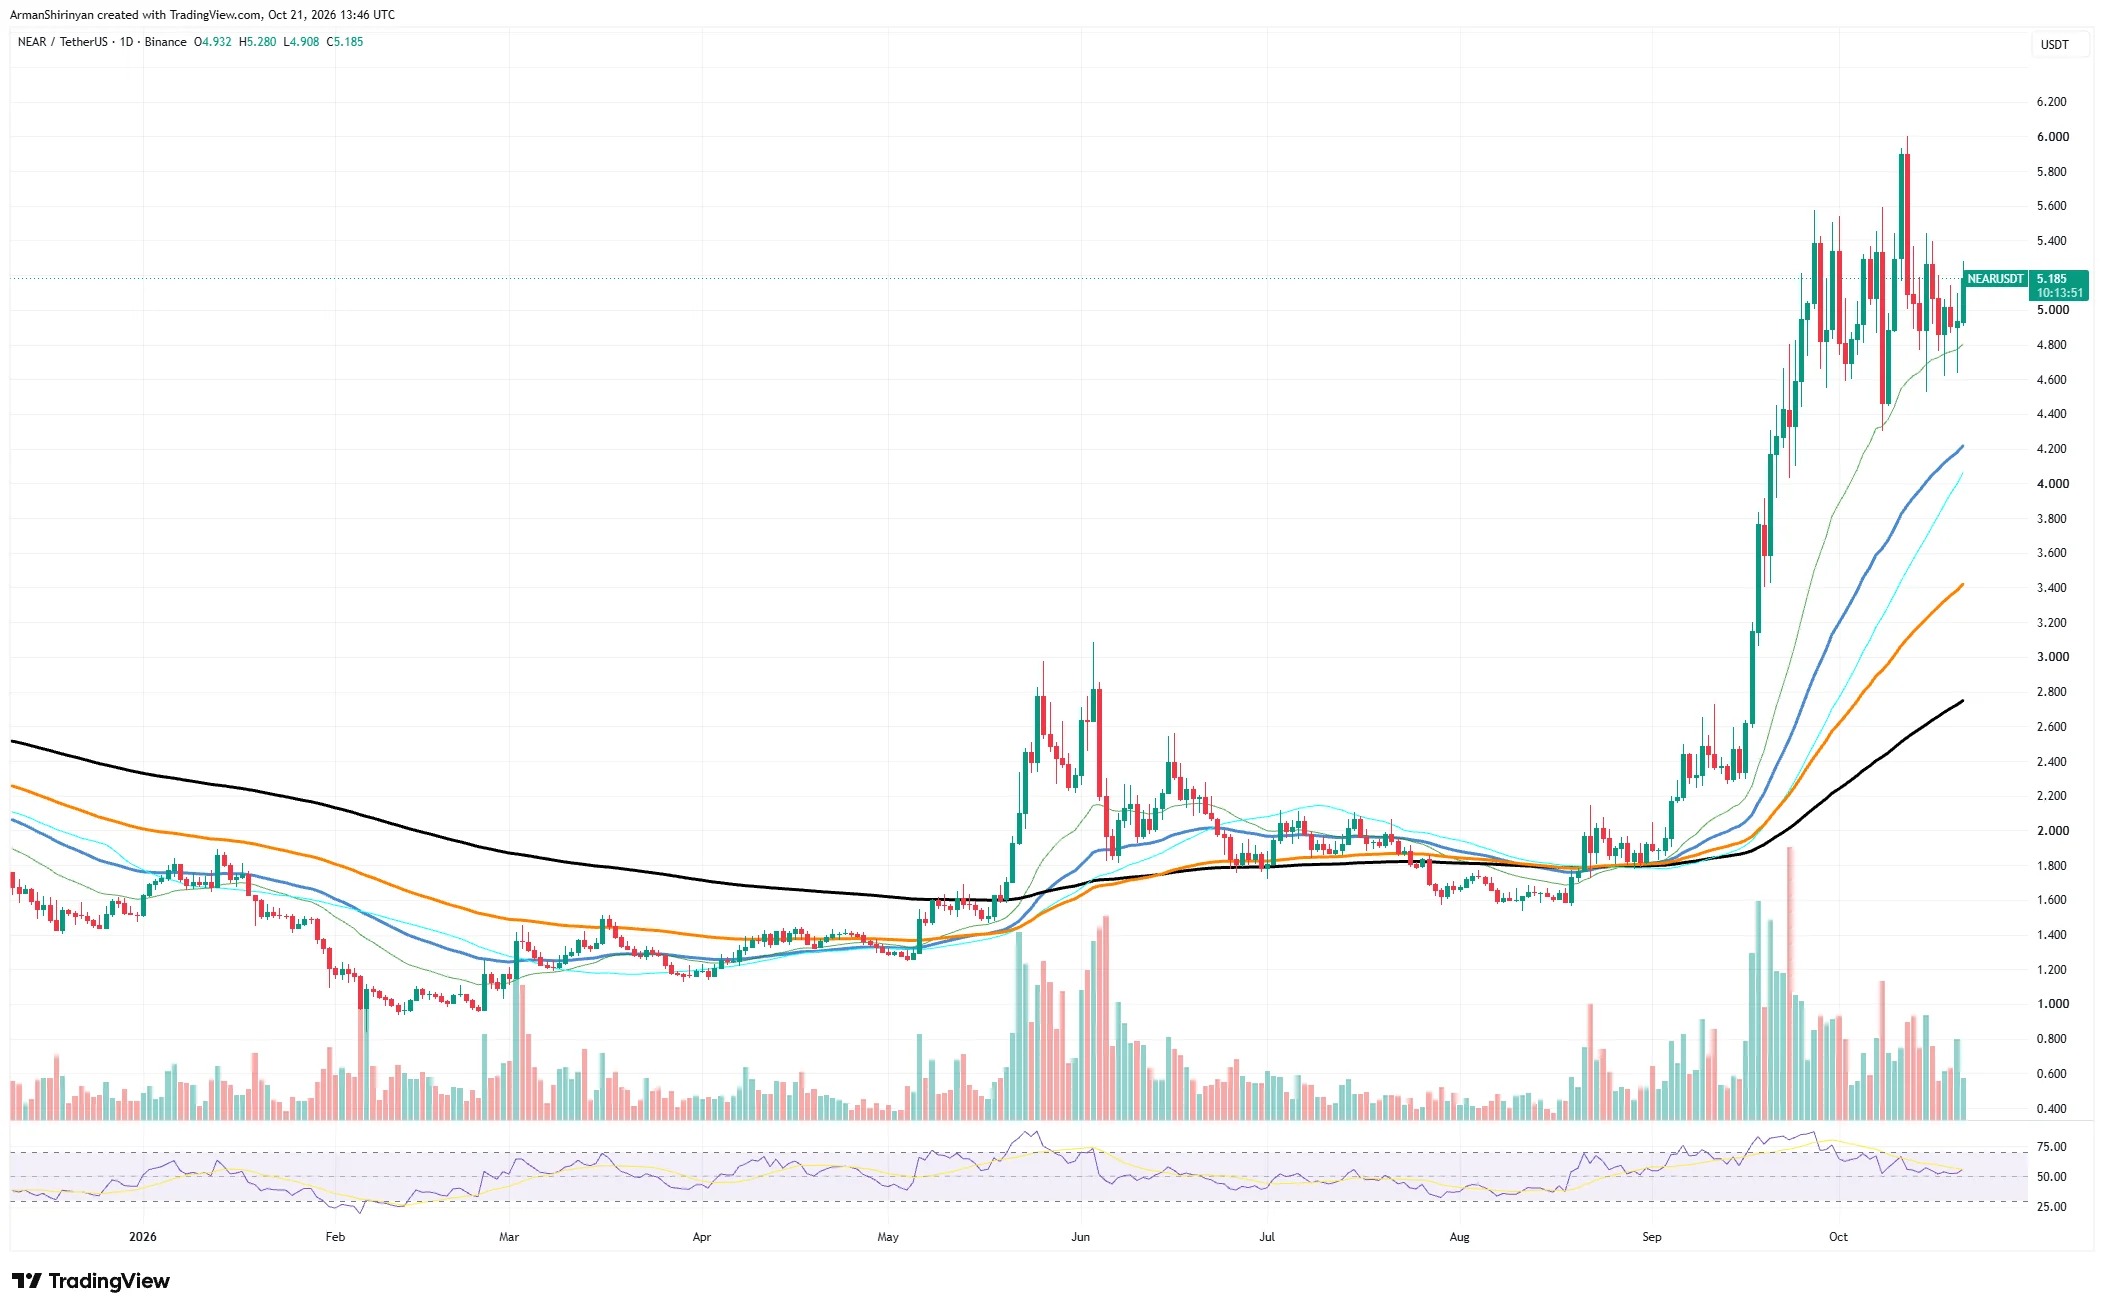
The first level to pay attention to is $5.60, which is also the upper edge of the current range. If the daily chart closes above this level, it will create room for a push towards the $6.00 high. If $6.00 is broken through, NEAR will enter the price discovery phase of this cycle. On the downside, $4.80 is the first support level, followed by $4.30, which is the recent low point.
If the daily close is below $4.30, it will indicate that buyers are losing control and could push prices towards the 50-day EMA around $4.20. For now, the trend is still upward. The NEAR is forming a bottom below the high points; if it breaks through $5.60, it could initiate the next phase of upward movement.
Zcash ( ZEC ) is one of the leaders in the rebound.
Zcash is currently trading at around $1,314, with a strong daily positive close, having recovered most of the losses from October. This coin has seen an astonishing upward trend this year, rising from around $480 in August to nearly $1,700 at the end of September.
After reaching a high point, ZEC once fell to a low of around $1,050. Although the decline was significant, the price remained above the 100-day EMA, which is at around $1,010. This level served as a safety net, and it was there that buyers entered the market.
The current rebound is very important. ZEC has once again reached the 20-day EMA at around $1,270 and is currently testing the range between $1,320 and $1,350, which was also seen during selling pressure at the beginning of October. The 50-day EMA at around $1,190 is now below this price level and should act as support if there is a pullback. The long-term outlook remains strong.
On the 200-day EMA, it is around $790 and is still on the rise, far below the current price. All major moving averages are upward, confirming that the main trend has not changed. RSI is currently close to 55 and has started to rebound from around 40, indicating that momentum is recovering after the pullback. Trading volume was low during the downward trend, but it increased slightly during the rebound period, which supports this trend.
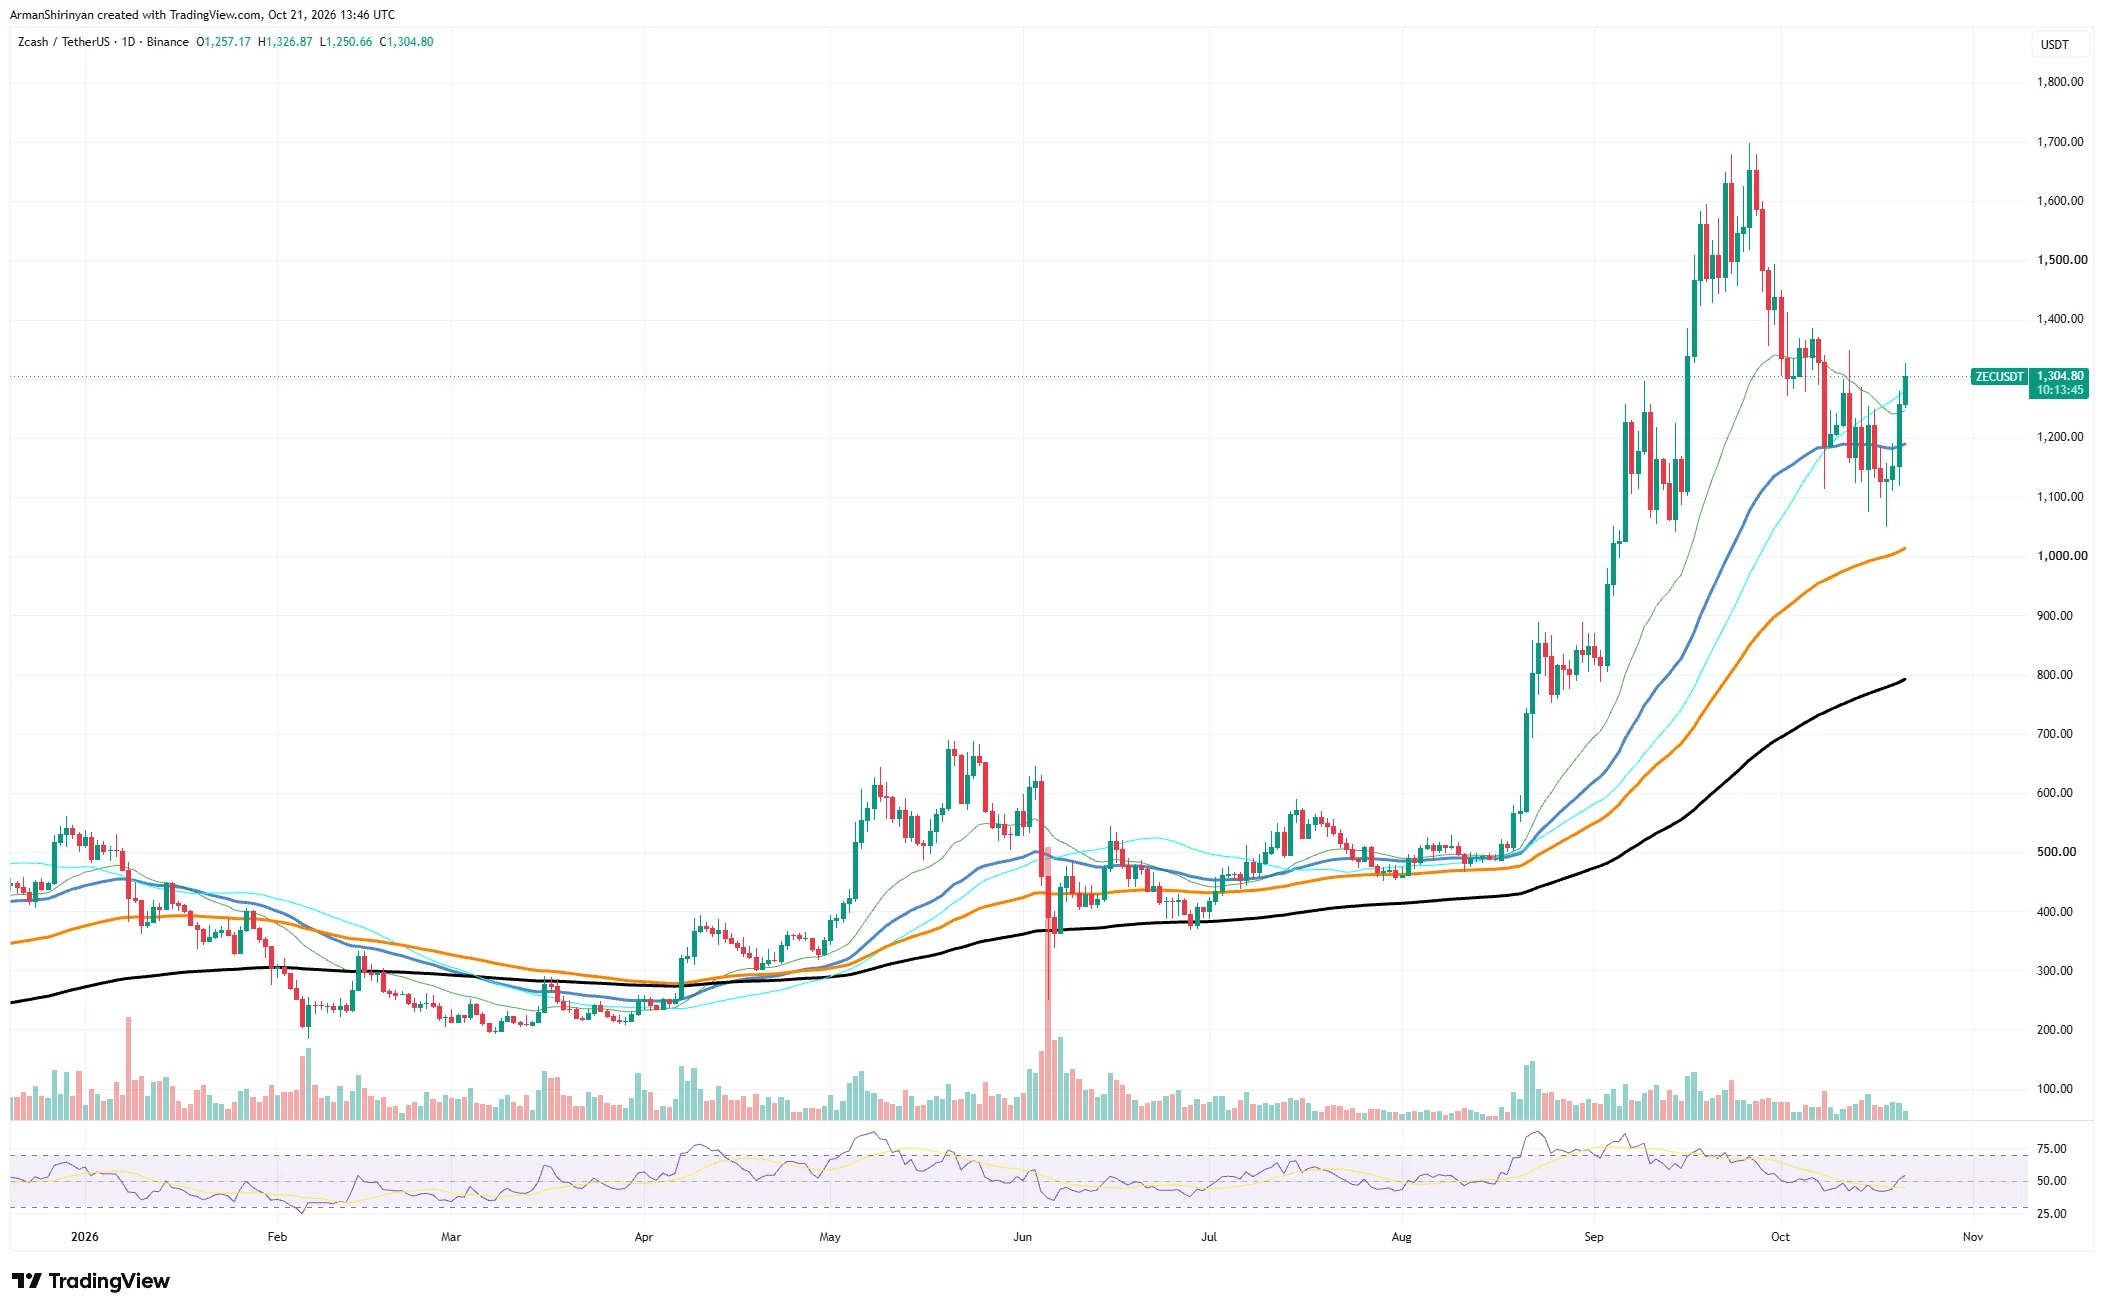
The key resistance levels are at $1,380, followed by $1,500. If the daily close is above $1,380, it will indicate that buyers have regained control of the market and may create room for a rise towards $1,500. A break above $1,700 could lead to new highs. In the event of a failed rebound, the support levels are at $1,190, followed by $1,050.
If it falls below $1,050, the 100-day EMA level at around $1,010 will come into focus, and that could weaken the bullish argument. For now, ZEC still holds the upper hand. Prices are rebounding, momentum is improving, and the trend remains upward. If the daily close is above $1,380, that will confirm the next upward move.
Dogecoin ( DOGE ) Low trading volume rebounds
DOGE is currently trading at around $0.0825, with a positive candlestick closed on the daily chart. The coin rose from around $0.070 in August to a high of nearly $0.106 in September, then lost some of its gains in October and fell to a low of around $0.076. The latest rebound is an initial sign of buyers returning. The price is currently not far below a set of moving averages.
On the 50-day EMA and 100-day EMA, the price is close to $0.0855, while on the 20-day EMA, it is around $0.088. The 200-day EMA is even higher at around $0.092 and has been suppressing any rebound attempts over the past few months. This area serves as the main resistance level for this round of recovery. The RSI is currently close to 45 and has rebounded from a weaker region, indicating that the selling pressure is diminishing.
Whether during the callback period or the rebound period, trading volumes were relatively low. This indicates that sellers did not exert significant pressure, but buyers have also not yet demonstrated true strength.
The first level to pay attention to is $0.0855. If the daily chart closes above this level, the price will once again exceed the 50-day and 100-day EMA, and it may open up space towards $0.088, and then towards $0.092. If it breaks through the 200-day EMA, it will be a signal of the first real change in the long-term trend.
On the downside, $0.080 is the main support level, followed by a recent low of nearly $0.076. If the daily chart closes below $0.076, it will point towards $0.070, which is also the bottom level that DOGE reached in July and August. For now, DOGE is still in the midst of a larger downward trend, with attempts at rebound. The rebound is indeed real, but it would be more meaningful if the price closes above $0.0855.
Ethereum ( ETH ) stabilizes at the support level
Ethereum is currently trading at around $2,482, with a positive candlestick on the daily chart. ETH rose from around $1,900 in August to a high of nearly $2,800 in September. In October, the price fell back to $2,320 and began to rebound after finding support there. This support came from the 100-day moving average at around $2,360 and the 200-day moving average at around $2,315. Both of these moving averages are upward and are close to each other, forming a strong support level at the bottom.
The buyer held this position, and the price immediately rebounded. Now, ETH is testing the 50-day EMA at around $2,480; this line represents the first real resistance level. The 20-day EMA is higher, at around $2,550, and constitutes the next hurdle.
The price must break through both of these moving averages simultaneously to indicate that the rebound has strength. RSI is currently near 45 and has rebounded from around 40, so the momentum is slowly recovering. Trading volume is at an average level, and there was no significant increase in volume during the rebound, which means that this trend still requires more buying interest to be fully confirmed.
If the daily close is above $2,550, that would be a strong signal. It would allow ETH to re-establish itself above the short-term moving average and open up the possibility of reaching $2,700, as well as the high point of around $2,800 seen in September. If it breaks through $2,800, a new local high will be set.
If the rebound is hindered at the 50-day EMA level, the support level is at $2,360, followed by $2,315. If the daily close falls below $2,315, it will break below the bottom and may push prices down to $2,100. For now, ETH seems more stable than most major cryptocurrencies. The main trend is still upward, and the long-term moving average is also rising below the current price. If the close is above $2,550, it will confirm the next upward move.
Success!