











The Office for National Statistics (ONS) of the UK released public finance data for September on October 21st, which contains a point that is particularly prone to misunderstanding: the preliminary estimate of the net debt of the public sector was 3.005 trillion pounds, surpassing the 3-trillion mark for the first time; however, this figure represents 94.0% of the Gross Domestic Product (GDP), which is 0.7 percentage points lower than a year ago. While one figure has reached a new high in nominal terms, the other ratio has decreased. Which one is more indicative of fiscal pressure? The answer is that both figures measure different aspects. Debt levels, economic size, borrowing flows, and interest burdens need to be considered separately; it is difficult to judge fiscal room based solely on a “whole number milestone.”
Debt size and debt ratio can move in different directions.
Net debt is a stock amount as of a certain point in time. The Office for National Statistics estimates that it was 300.5 billion pounds at the end of September, which is 91.7 billion pounds more than a year ago; the debt ratio is calculated by comparing debt to the economic size during the same period. Even if the absolute amount of debt continues to increase, as long as nominal GDP also grows, and the growth rate is faster than that of debt for a certain period, the ratio may still decrease. This does not mean that the debt has been repaid, nor does it automatically imply that it is easier for the government to pay interest. Inflation will push up nominal GDP, and it may also raise the interest on debt that is linked to inflation. These two trends may exist simultaneously.
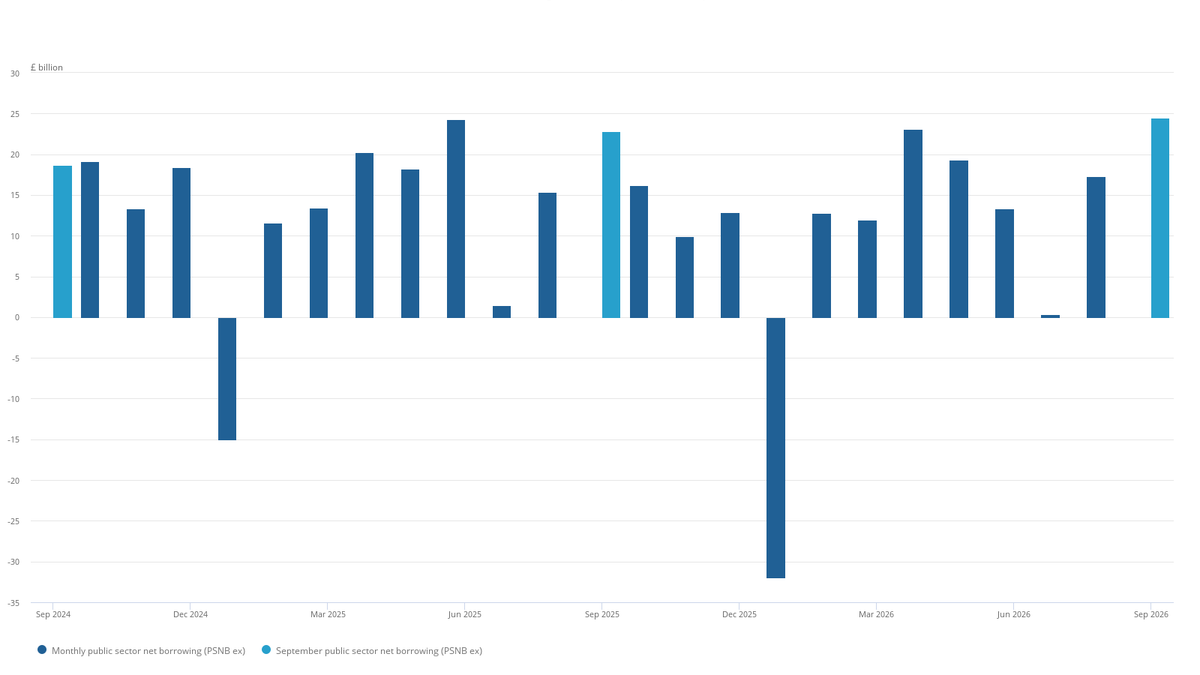
The Office for National Statistics clearly states that the debt figure of over 3 trillion pounds is a preliminary estimate, which may be revised later on. The outside world can refer to this as "the first estimate exceeding 3 trillion," but they should not treat this preliminary value, which is still subject to revision, as an immutable historical conclusion. It also does not confuse the annual new borrowing with the total debt stock: in September alone, the public sector's net borrowing was 24.5 billion pounds, an increase of 1.8 billion pounds from the same period last year; in the first six months of this fiscal year, the cumulative borrowing amounted to 97.8 billion pounds, which is 4.4 billion pounds less than the same period last year, yet it is still 6 billion pounds higher than the forecast of the UK Office for Budget Responsibility. Monthly figures, annual accumulations, and end-of-year balances each answer different questions.
Why has the cumulative borrowing situation improved year-on-year, yet in September it weakened? The key lies in the different time frames used for observation. The performance of several months over the past six can offset the deterioration of the most recent month; moreover, fiscal forecasts and actual figures from last year serve as two benchmarks. Being below the level of the same period last year does not necessarily mean being below the original budget plan. According to the statistics bureau, the debt interest expenditure for September was 10.9 billion pounds, an increase of 1.6 billion pounds compared to the previous year, and 2 billion pounds higher than what the Budget Responsibility Office predicted. The fact that interest expenses can still squeeze financial space even when revenue is growing indicates that a "decrease in the debt ratio" does not necessarily mean a reduction in fiscal pressure.
There are also risks of forecasting and revision in the borrowing figures.
Public finance news tends to mistake "exceeding expectations" for a change in trend, but budget forecasts are inherently based on a set of assumptions regarding economic growth, taxation, prices, and interest rates. In September, the UK central government's recurring revenues amounted to 90.1 billion pounds, higher than the 85.6 billion pounds of the same period last year; however, the increase in tax revenue did not fully offset the rise in expenditures. The statistical office specifically notes that estimates for borrowing in recent months are likely to be revised in subsequent months, and some public enterprises and pension programs rely heavily on annual data. When looking at the published figures, it is important to recognize the overall direction and the sources of errors, rather than drawing conclusions about future budgets too early.
Interest on debt further complicates the issue. Changes in bond yields do not immediately and proportionally reprice all existing debt, but newly issued bonds and refinancings upon maturity will gradually be affected by market prices; some index-linked government bonds are also adjusted according to inflation. As a result, the market needs to consider both the scale of borrowing, the structure of debt maturities, and future financing needs simultaneously, and cannot simply buy or sell assets based on the debt ratio at the end of a period. For the average reader, "how much money the government owes" and "how much money the government still needs to borrow this year" represent two different scenarios. Only by considering them together can one get a closer approximation of the true fiscal picture.
In addition, the UK has also announced a broader definition of net financial liabilities. At the end of September, the preliminary estimate of the public sector's net financial liabilities was 2.6434 trillion pounds, which is equivalent to GDP% of that figure. This indicator includes certain financial assets and liabilities that are not part of the net debt definition, so the value and direction of change may differ from that of net debt. It is not intended to be the "correct answer" that replaces the figure of 3 trillion pounds; rather, it provides another perspective for observing the government's balance sheet. When comparing countries or years, it is essential to first ensure that the definitions being used are consistent.
What can be confirmed for now is that in September, the UK's borrowing was higher than in the same month last year, interest on debt increased, and the preliminary estimate of net debt at the end of the period exceeded 3 trillion pounds for the first time; at the same time, the debt to GDP ratio is lower than it was a year ago, and the cumulative borrowing for the fiscal year is also lower than the same period last year. These facts are sufficient to indicate that there is both pressure and improvement, but they are not enough to assert that the UK's finances are out of control or have safely landed. What is more worth watching going forward are data revisions, whether taxes will continue to cover the growth in expenditures, and the deviations between interest costs and budget forecasts. Only by gathering these subsequent pieces of evidence can we be qualified to determine what that prominent integer figure actually means.
If we are to link fiscal figures with financial markets, we must also maintain a sense of proportion. Government borrowing demand is one of the factors that affect the supply of government bonds, and yields are also influenced by inflation expectations, monetary policy, and global capital flows; the daily fluctuations in bond prices cannot be attributed solely to a single fiscal report. For households, 3 trillion pounds is not an immediate bill evenly distributed among each person; for businesses, it is not evidence that tax rates will change in the current month either. It is more like a cross-section of a long-term balance sheet, reminding the public to pay attention to how the government raises funds, where the money is spent, and whether future economic growth will be able to support interest payments and public services. The value of monthly statistics is to provide a verifiable starting point for these discussions, rather than to offer a single answer for political or investment decisions.