














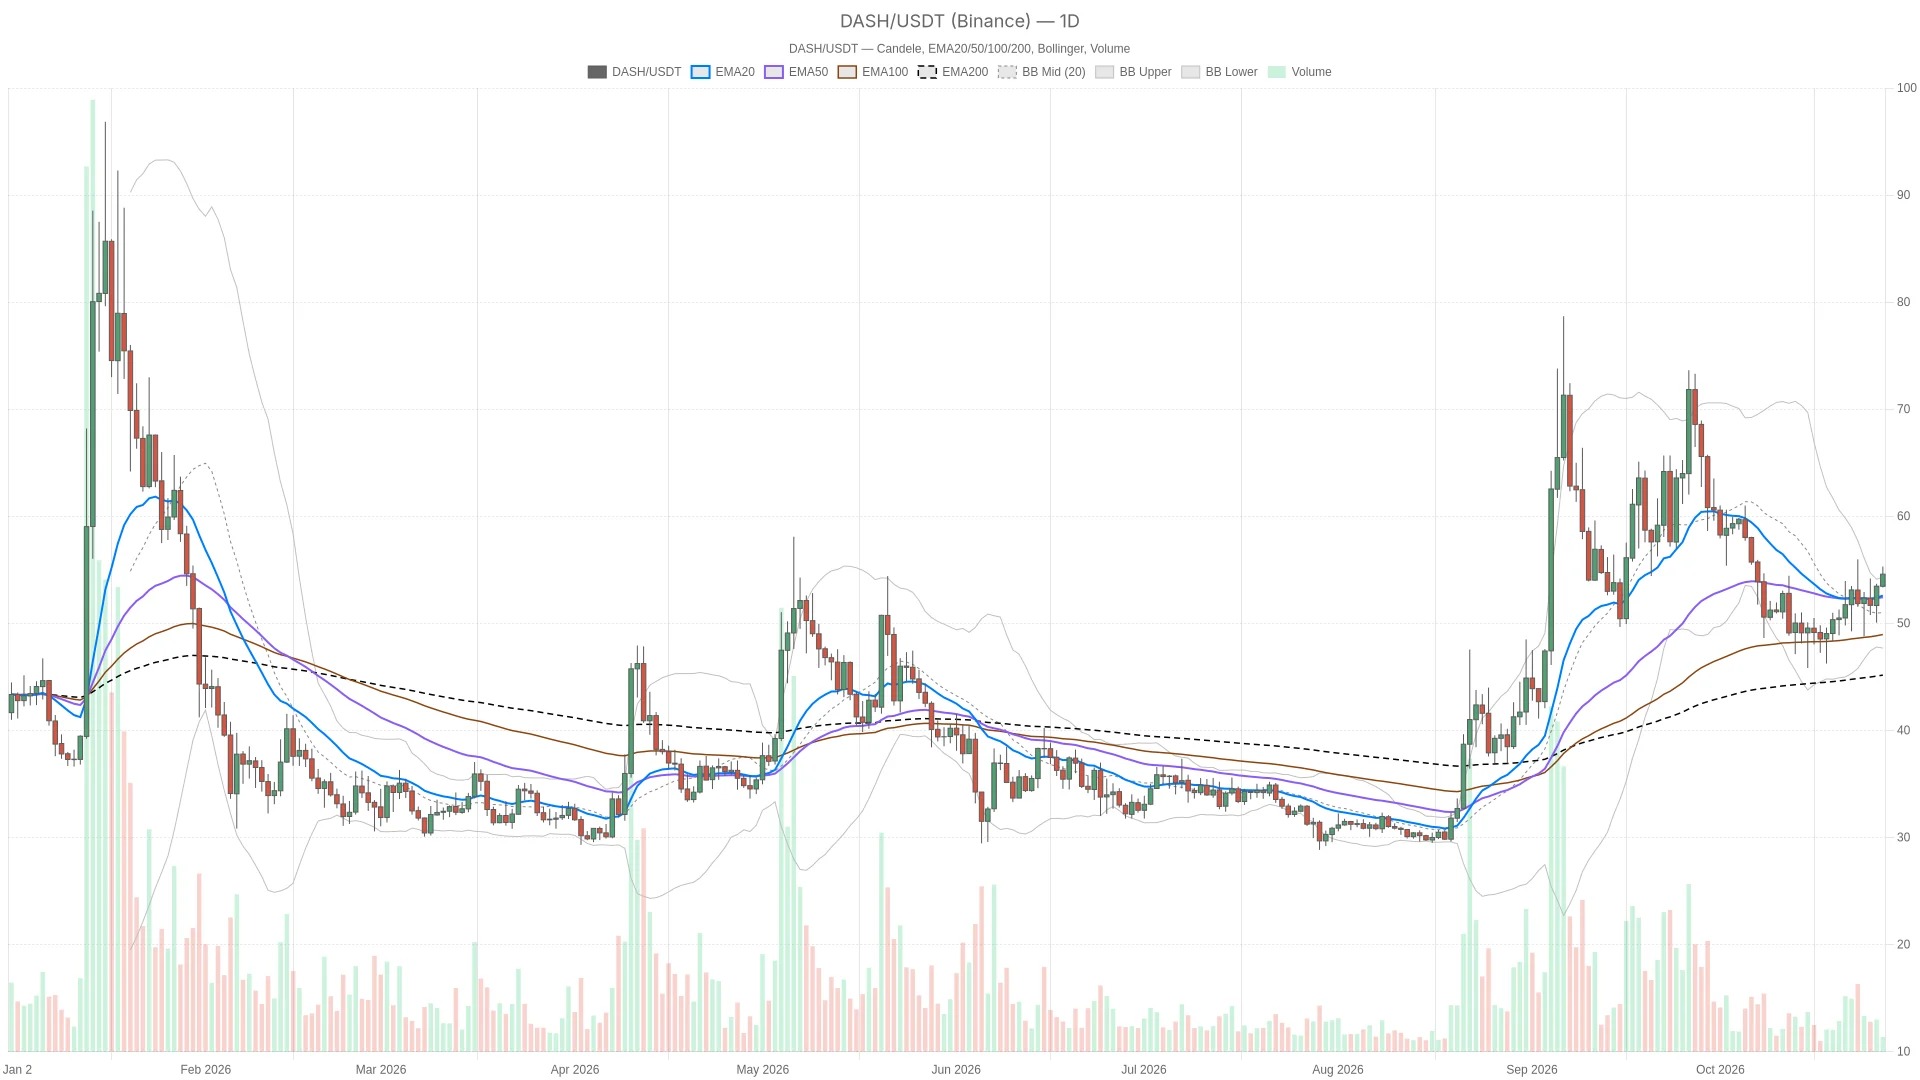
As of October 27, 2026, DASH was trading at $54.59 on Binance. The daily chart structure for Dash remains bullish, but a breakout has not yet been confirmed. Improved daily momentum supports the continuation of this trend; however, below the daily R1 level of $54.75, weaker short-term momentum poses a risk of mean reversion.
Key Points
- DASH is trading at $54.59 on Binance, and the price is still above the daily EMA, but it has not yet confirmed a close above the R1 of $54.75.
- On the daily chart, EMA20, EMA50, and EMA200 show a bullish alignment; however, the 15-minute momentum is weakening, while the larger-scale trend structure remains intact.
- If the daily chart closes above $54.75, it will confirm a continuation of the bullish trend; if the hourly chart closes below $54.51, it will trigger a bearish scenario.
- The daily line RSI is at 51.8, the hourly line RSI is at 68.2, indicating support for the continuation of the trend; however, the 15-minute MACD bar chart shows narrowing, suggesting a weakening of short-term momentum.
- The total market value of cryptocurrencies is 2.69 trillion US dollars, with Bitcoin accounting for 59.43%, and the Fear and Greed Index is neutral.
There are more positive signals on the daily chart, and this is also generally confirmed on the hourly chart. However, the 15-minute chart indicates that momentum is weakening, which raises doubts about whether the market can continue to rise in the short term. Nevertheless, this does not undermine the larger-scale trend. The moving averages across the three time frames remain bullish. The divergence appears on the 15-minute chart: although the underlying trend structure is still intact, the momentum is weakening. A short-term pullback alone does not constitute a reversal at the daily chart level.
The previous completed hourly chart closed at $55.04, which is higher than the hourly pivot point of $54.90, but the current real-time price has fallen below that pivot point. In other words, the breakout from the previous phase did not continue into the current K-line. The 15-minute chart here is more suitable as a reference for execution purposes, rather than to overturn the overall bullish judgment based on the daily chart.
Bullish arrangements on three time frames EMA maintain a sound trend structure. However, the price is operating above the upper band of the daily Bollinger Bands, indicating that the price is in an extended state rather than having confirmed a breakout. On the daily chart, the price is higher than EMA20 at $52.39, EMA50 at $52.34, and EMA200 at $45.07, with the moving averages showing a bullish arrangement. The short-term moving averages are close to each other, indicating a relatively positive structure, but this does not mean there is a large gap between them.
The price is also higher than the three EMA levels on the hourly and 15-minute charts, both of which are also in a bullish arrangement. The hourly EMA20 level is at $53.31, which serves as a deeper structural reference below the immediate support level. Looking across various time cycles, although the momentum in the shortest cycle has weakened, the overall trend remains intact.
The upper band of the daily Bollinger Bands is at $54.12, which is below the current price, and has now become a support level in the vicinity. The price being outside this upper band indicates that it is in an extended state, rather than undergoing an automatic reversal. The middle band of $50.96 and the lower band of $47.79 describe a deeper mean reversion range, which is not the main area of contention at present.
The daily line ATR is at $3.88, the hourly line ATR is at $0.80, and the 15-minute line ATR is at $0.45. These readings indicate that the significance of nearby technical boundaries needs to be understood within the context of volatility: crossing a certain line alone is not sufficient to prove that a lasting change in direction has occurred. A confirmation by the K-line is more important than a single price touch.
Both the daily and hourly charts RSI support a bullish scenario, and they have not entered an overbought extreme; however, the narrowing of the 15-minute MACD bar chart reveals a gap between the strength of the trend and the momentum for execution. The daily chart RSI is rising towards 51.8, indicating that the bullish structure has some momentum support, but it is not aggressive. The hourly chart RSI is also rising, at 68.2, close to the overbought area but not yet there. In contrast, the 15-minute chart RSI has fallen back to 53.9, indicating that the immediate buying pressure has weakened, but a clear bearish dominance has not yet formed.
MACD further confirms this differentiation. The daily bar chart shows positive values and is expanding, although the MACD line is still negative: there is indeed momentum in the market recovery, but the daily chart does not indicate overall strength. The hourly bar chart also shows positive values and is expanding, supporting the judgment of a continuation at a larger scale. On the 15-minute chart, the positive bars are narrowing, which indicates that the short-term momentum behind the next upward move will be weaker.
The key level for confirming a bullish trend is for the daily chart to close above $54.75, whereas closing below $54.51 on the hourly chart would trigger a short-term bearish scenario; as of the most recent completed K-line, neither of these conditions has been met yet.

Bullish scenario: If the daily close is above $54.75, which is the R1 level, it will confirm a continuation signal; the previous completed daily close was at $53.47, which does not meet this condition. If this boundary is broken through, the hourly Bollinger Band upper band at $54.79, the hourly pivot point at $54.90, and the hourly R1 level at $55.44 will constitute the next set of resistance levels. However, if the daily close falls below the hourly Bollinger Band upper band at $54.12, then this breakout structure will become invalid.
Bearish scenario: If the hourly chart closes below $54.51 (which is marked as S1), it will trigger a short-term breakout scenario. The previous completed hourly chart closed at $55.04, which does not meet this condition yet. At that time, the upper band of the daily Bollinger Bands at $54.12 will become the next support level to be tested. If the weakness continues, $53.31 (marked as EMA20) on the hourly chart will be the subsequent reference level. If the hourly chart closes back above the upper band of the hourly Bollinger Bands at $54.79, then this breakout scenario will no longer apply.
The daily pivot point of $52.41 represents an even deeper dividing line, close to the daily levels EMA20 and EMA50. The daily level S1 at $51.12 is located below it. If prices fall back near these reference points, the impact on the bullish outlook for the daily chart will be greater than simply losing hourly support. The most likely false signal would be a brief price break above the resistance near this level, only to fail to hold; this aligns with the narrowing of the 15-minute MACD bar chart pattern. On the opposite side, there is a risk of prices briefly falling below the hourly S1, but the overall daily trend remains constructive. ATR indicates that there is room for both types of false breaks; these scenarios depend on the completed K-line patterns, rather than just temporary touches during trading hours.
The broader market sentiment is neutral; it neither provides a tailwind for the current structure nor creates headwinds. CoinGecko shows that the total market value of cryptocurrencies is 2.69 trillion US dollars, with Bitcoin accounting for 59.43%. These are merely background levels and do not indicate any directional change in dominance. As for the price structure of DASH, the sentiment neither provides clear support for risk appetite nor constitutes an extreme defensive context.
Frequently Asked Questions
Will a slowdown in the short term reverse the bullish outlook on the daily chart?
No. The readings show that the momentum weakens after 15 minutes, but the daily and hourly charts EMA still show a bullish pattern. This represents a disagreement regarding whether the trend can continue to rise at present, rather than confirmation of a reversal on the daily chart.
DASH Is it currently in overbought territory?
None of the readings given for RSI exceed 70. The hourly line readings are approaching this threshold, while the daily line and the 15-minute RSI readings are closer to neutral.
This article was generated with the assistance of artificial intelligence and has been reviewed by an editorial team.
Lorenzo Marcek is a financial journalist and senior crypto market analyst, known for his clear, data-driven reporting on digital assets. With a background in economics and over a decade of experience covering global markets, he specializes in on-chain indicators, institutional adoption trends, and macroeconomic factors that influence cryptocurrency prices. His work combines investigative journalism with technical market insights, making him a trusted source for traders seeking solid and actionable analysis.