












The price of Bitcoin is currently within a trading range with high volume. If it manages to break back above $80,000, it could gain momentum for a rebound towards $85,000.
The liquidation heat map shows that there is a clear short-selling liquidation cluster around $82,000, which makes it an important resistance level that needs to be broken through.
The volatility in the crypto market has intensified recently, while Bitcoin prices are still trying to maintain a rebound. Following reports of a $6.3 billion security vulnerability at Binance, market uncertainty has further increased. After Bitcoin fell to a low of $76,460, it has been difficult for the price to recover and stabilize above $78,000, as there has not yet been a convincing bullish reversal. However, the liquidation heat map indicates a hidden bullish divergence, suggesting that a short squeeze could occur.
Therefore, the market will be watching whether Bitcoin can attract enough buying interest to trigger a short squeeze and rebound above $85,000, or whether it will fall below $70,000 due to new selling pressure.
Bitcoin is under pressure around $78,000, with increasing selling pressure.
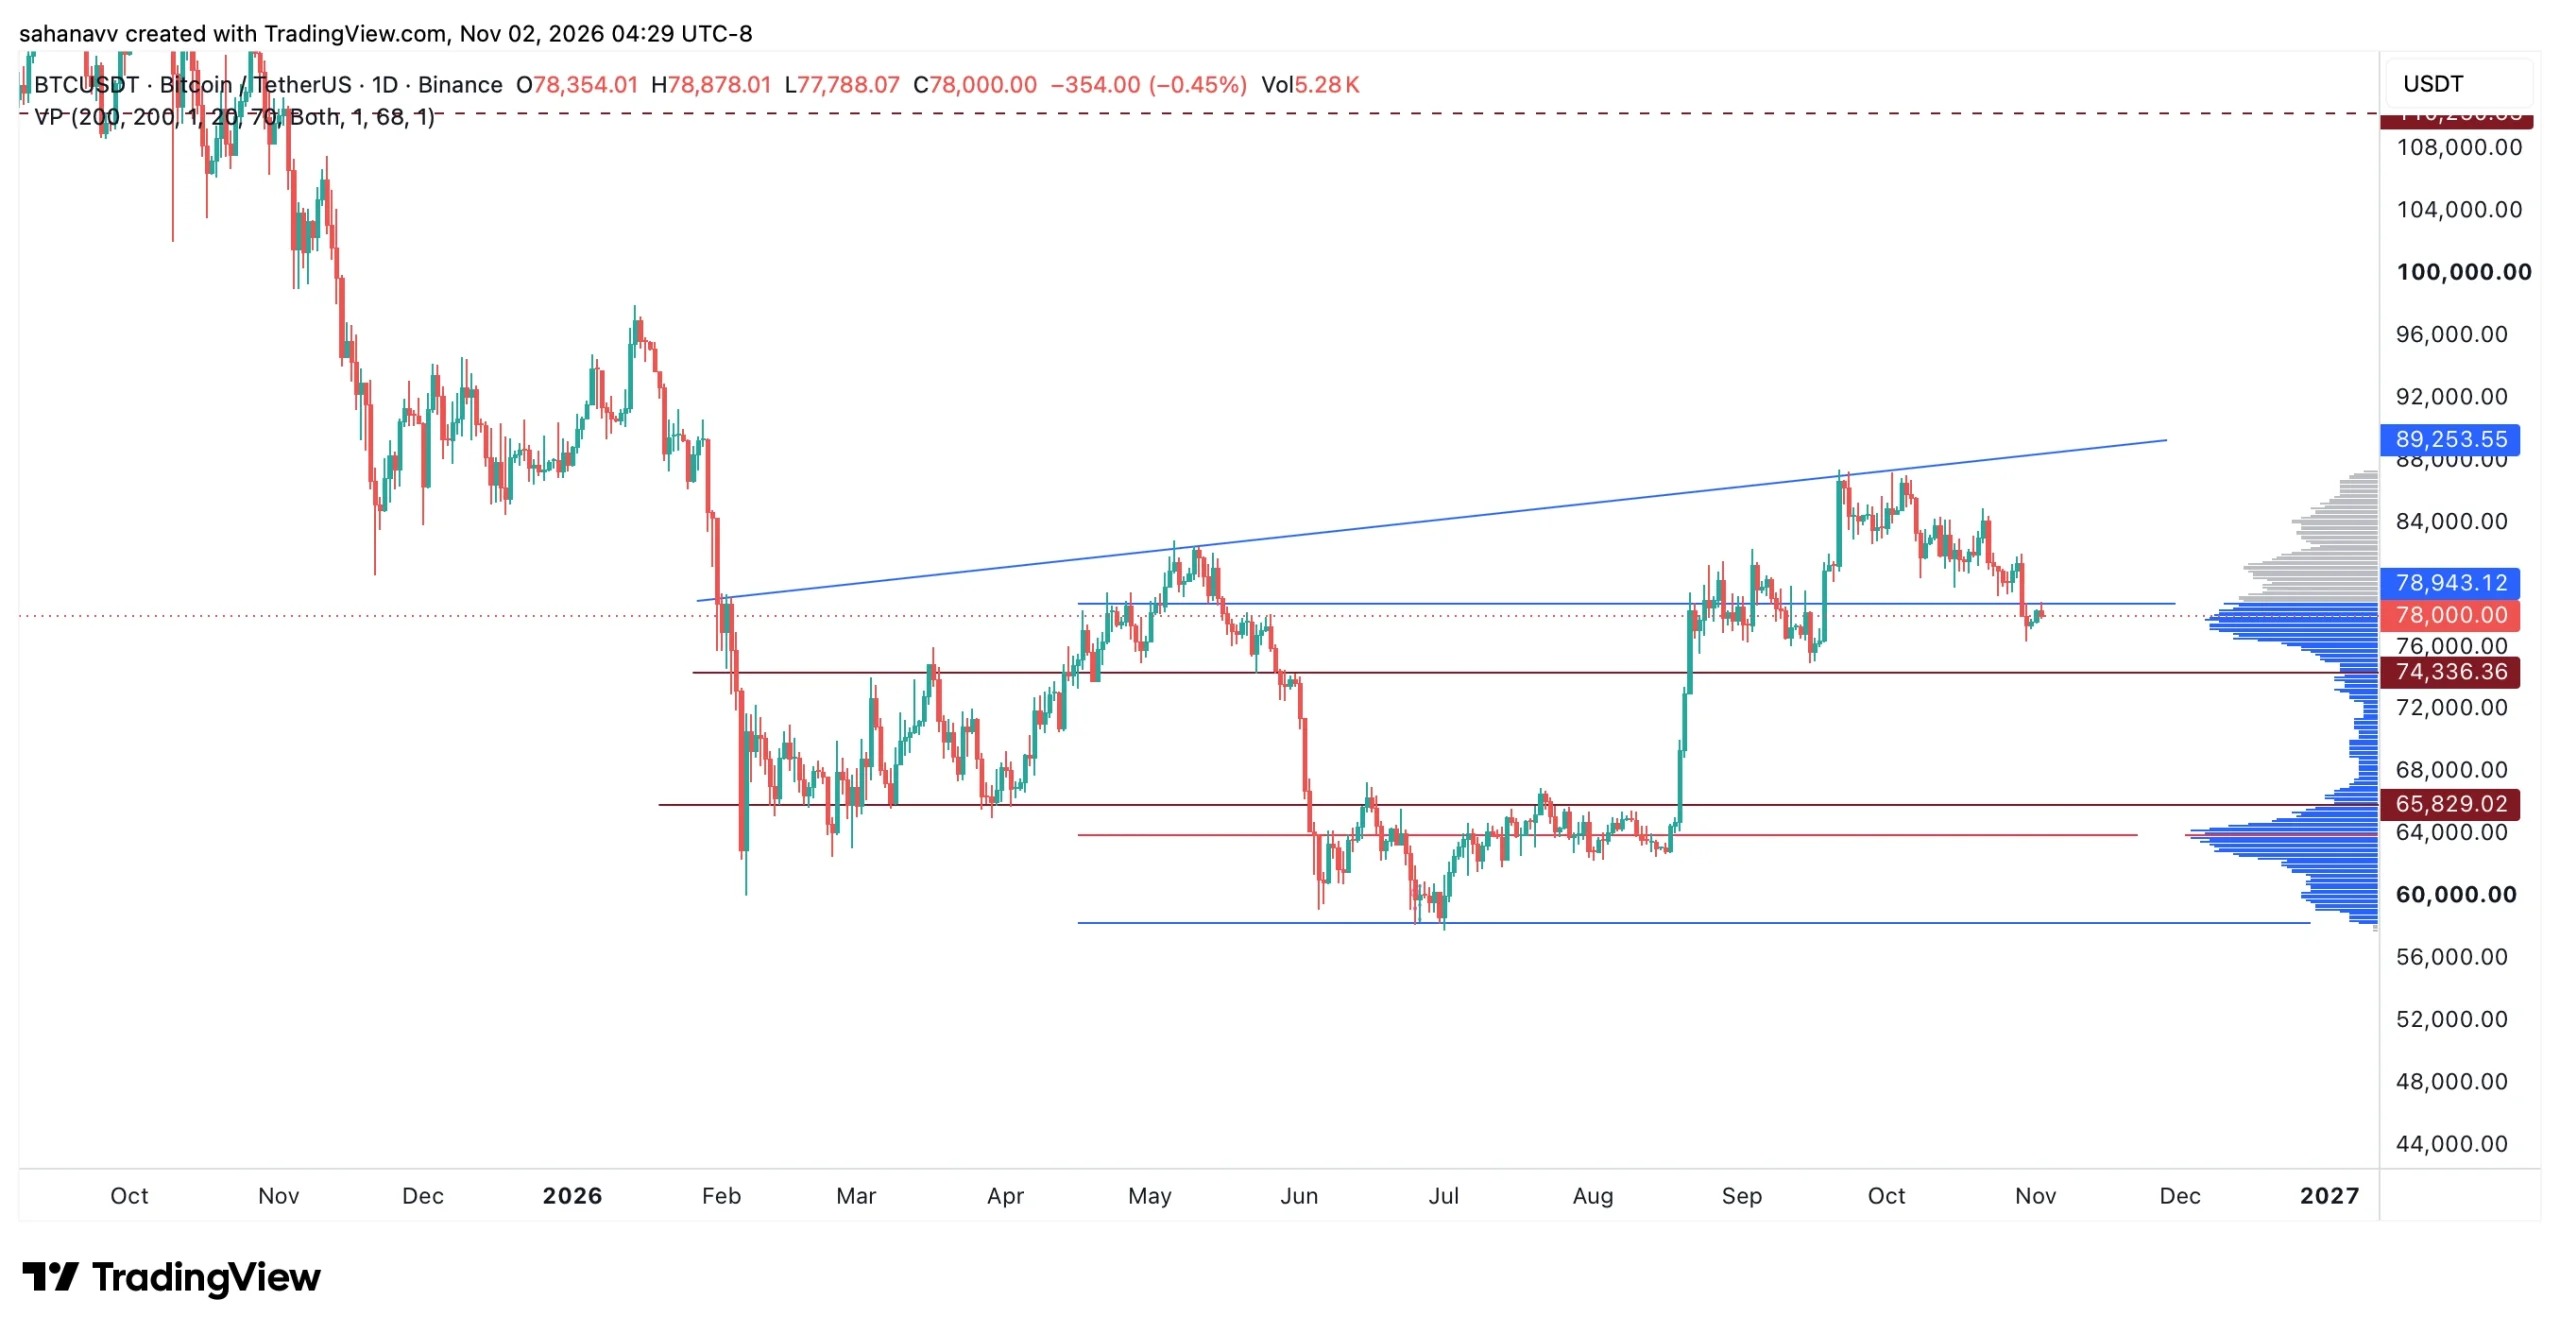
After a recent rebound from lows, the price of BTC is attempting to stabilize around $78,000. However, charts indicate that buyers have not yet regained control, and Bitcoin remains below the important resistance level of nearly $78,943. As lower highs and lows continue to form, the token is trying to find support around $78,000.
Volume distribution shows that trading activity is highly concentrated in the range of $76,000 to $79,000. This makes the current price range particularly important, as it represents the area where a large amount of market participation occurs. Since this crypto asset is being traded within this high-volume region, whether it can maintain this range will become an important factor in determining the next trend.
If buyers are able to hold this level and re-establish a price of $78,943, the rebound could extend to $80,000 or even higher. However, if they fail to do so, the price may fall back and test the support level of $75,000; further below that would be the psychological barrier of $70,000.
BTC The liquidity map indicates that $85,000 is a key upward area.
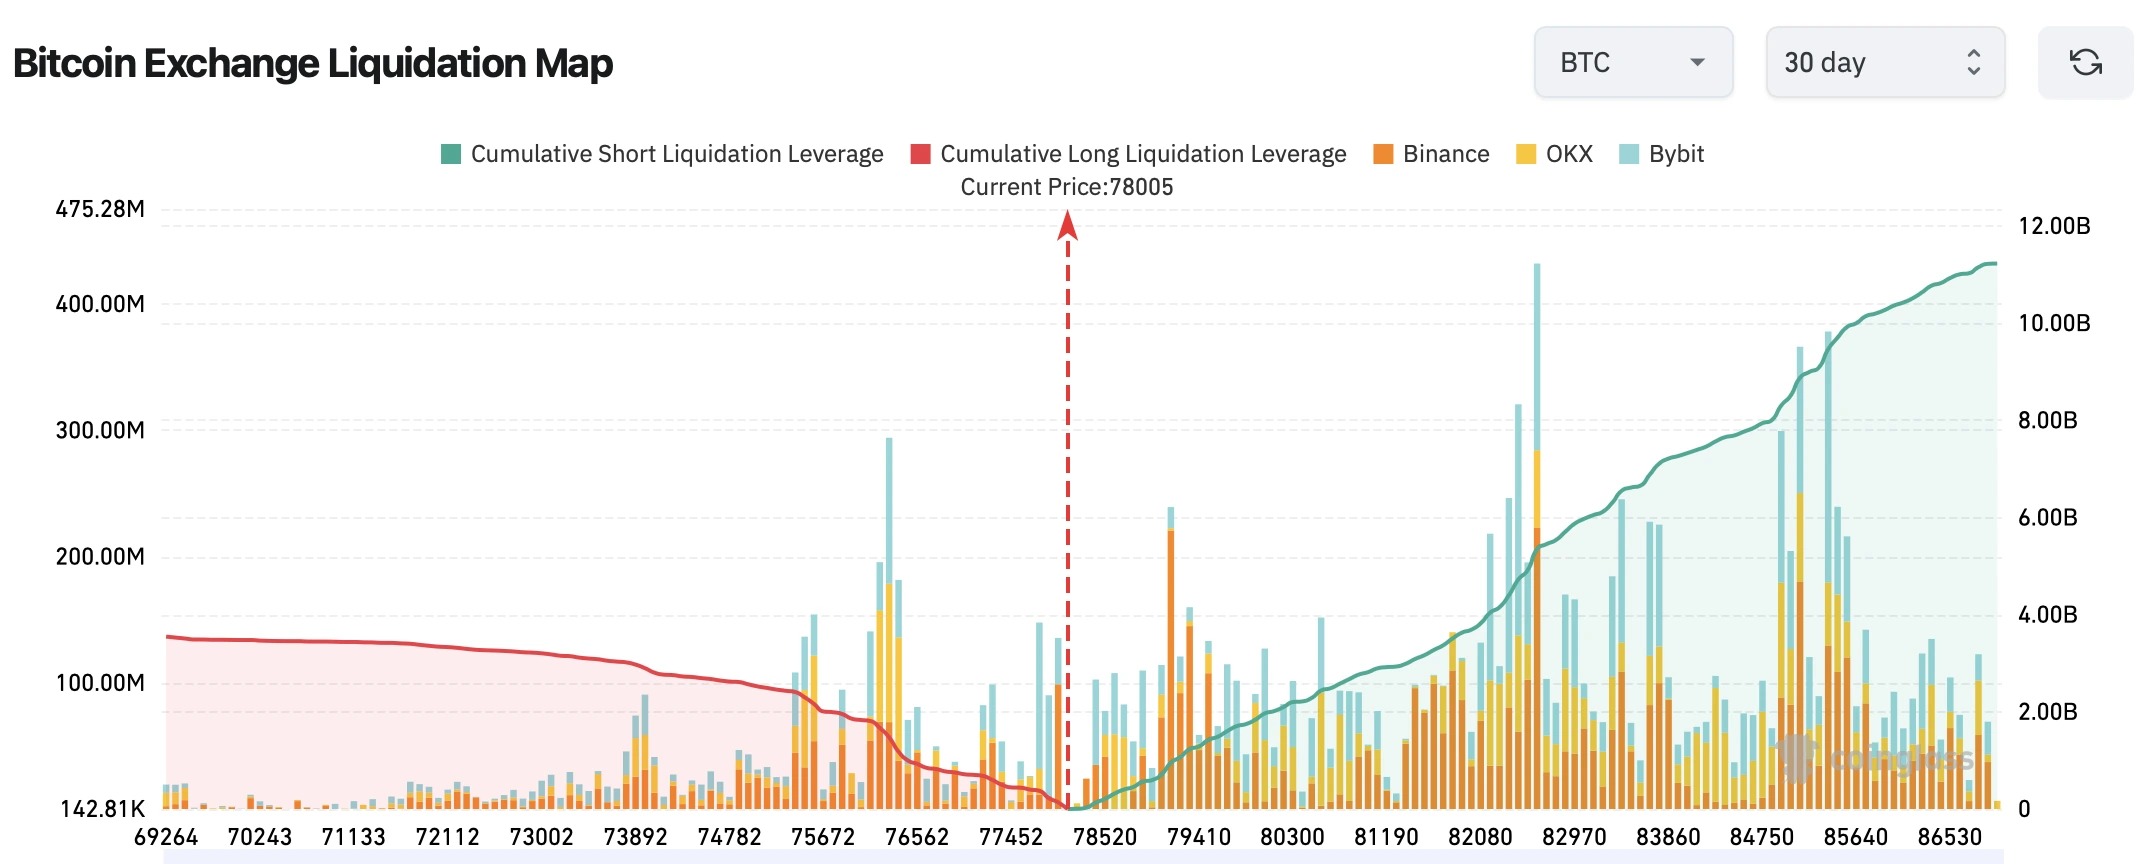
The trading volume distribution chart identifies the areas where Bitcoin attracts a large amount of trading activity, while the liquidation heat map shows the positions that may be under pressure due to leverage. The liquidation heat map below indicates a clear imbalance between potential short and long liquidations near the current price.
When the price of BTC approached $78,000, the cumulative short liquidation leverage above the current price was significantly higher than the potential long liquidation leverage below it. The chart shows that at the upper end of the indicated range, the cumulative short liquidation leverage was close to $11 billion, while the potential long liquidation leverage in the downward direction was about $3.5 billion.
If the rebound continues, it may force leveraged short sellers to close their positions, thereby further increasing buying pressure and driving prices to move more rapidly towards areas with higher liquidity, potentially reaching $85,000.
Will Bitcoin trigger a short squeeze to rise to $85,000, or will it fall below $70,000?
The next move for Bitcoin could present opportunities for the bulls. If they are able to regain control of the $79,000 to $80,000 range, there is a possibility of an upward squeeze forming. Given that there is a relatively concentrated short-selling liquidation above the current price level, the likelihood of an upward squeeze increases accordingly. Therefore, if buyers manage to push prices back above $80,000, a short squeeze towards $85,000 could gain momentum. However, if the support at $74,336 is lost, the advantage will shift to the sellers, putting the $70,000 level at risk.