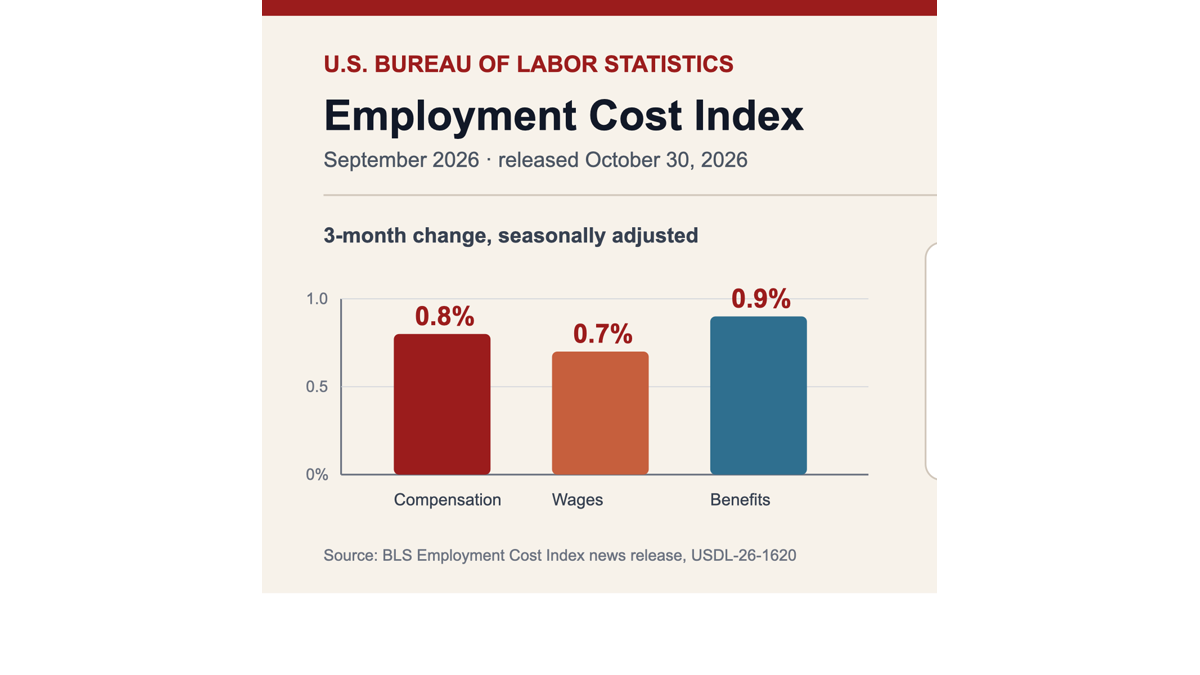
















U.S. companies continued to experience rising total costs for employees in the third quarter, but "increasing costs" and "improved purchasing power of employees" are not the same thing. According to data released by the U.S. Bureau of Labor Statistics on October 30, from July to September 2026, the total compensation costs for employees of private and local governments rose by 0.8% after seasonal adjustment; of this, wages and salaries increased by 0.7%, while benefits costs rose by 0.9%.
Extending the observation period to one year results in a total compensation increase of 3.4%, with wages and salaries increasing by 3.1% and benefits rising by 3.9%. The same report also provides figures calculated in constant dollars: wages and salaries in the private sector decreased by 0.6% year-on-year. In other words, although nominal wages are still increasing, purchasing power has not improved accordingly after adjusting for prices.
This set of data comes from the Employment Cost Index ECI. It measures the changes in the prices that employers pay for labor and tries to exclude the structural impacts caused by workers moving between industries and occupations. It is different from the average hourly wage: if high-paying industries suddenly hire more people, the average may change, whereas ECI attempts to stabilize the job structure, providing a closer representation of "how the cost of the same amount of labor changes."
Benefits are increasing faster than salaries.
Within the total cost increase of 0.8% in the third quarter, benefits rose by 0.9%, which is higher than the 0.7% increase in wages and salaries. Year-over-year, benefits increased by 3.9%, also exceeding the 3.1% increase in wages. As a result, the employment pressure felt by companies comes not only from wages but also includes costs related to healthcare, retirement, and other benefits.
Official figures show that the cost of health benefits in the private sector has increased by 6.4% year-on-year. This figure cannot be directly equated with a 6.4% increase in premiums for each employee, as the ECI measures the employer cost index, not a single bill received by a family. However, it indicates that focusing solely on wage growth rates overlooks the even faster increases in corporate labor budgets.
Differences also exist between unionized and non-unionized positions. In the private sector, the total compensation for unionized employees increased by 4.3% year-on-year, while for non-unionized employees it increased by 3.3%; wages and salaries for both groups rose by 4.3% and 3.0% respectively. The gap described reflects cost changes during the survey period, and it is not possible to infer the long-term outcomes of all union negotiations or all industries based on this one quarter alone.
0.8% is not a 20% discount for the whole year, nor does it refer to new job positions.
The quarterly figure of 0.8% represents a three-month change that has been seasonally adjusted, while the annual figure of 3.4% represents a twelve-month change that has not been seasonally adjusted. Since the time frames and methods of calculation for both are different, they cannot be directly subtracted from each other to determine how much wages have suddenly cooled down. Similarly, this survey does not provide information on the number of new jobs created in the market, nor is it equivalent to the number of non-farm payroll positions reported in employment statistics.
The sample covers 28,000 occupational observations from approximately 6,600 private enterprises, as well as 7,300 occupational observations from around 1,400 state and local government units. Sampling means that there are statistical errors in the results, and official figures also provide standard deviations separately. When readers see one decimal place, they should not assume that it represents an exact and consistent increase for every industry.
Local and state government employees saw a 0.6% increase in total compensation in the third quarter, which is lower than the 0.8% growth in the private sector; year-over-year, it increased by 3.5%. The pace of growth varied across different departments. When formulating budgets, companies need to consider their own industry and profession more closely, rather than applying a general index for all employees to a single position.
The core constraint presented by this data is that labor costs are still increasing, and benefits are rising faster than wages, while actual wages have still decreased year-on-year. For businesses, this means that reducing the number of hires may not immediately eliminate the cost pressure for individual positions; for families, an increase in nominal wages does not automatically translate into greater purchasing power. Employment levels, wage prices, and living costs need to be considered together in three different contexts, as no single set of data can provide a complete picture on its own.
It should also be noted that ECI will update the fixed employment weight in December 2026 when the data is released, and remove the cost of work-related injury compensation. This adjustment to the method helps to bring the weights closer to the current employment structure, but it also means that when studying long-term sequences, one needs to look at continuous series explanations, rather than mechanically piecing together the new version of the index with a certain detail from the old version.
Regarding interest rate judgment, a slowdown in wage costs may alleviate the pressure of service inflation, while an acceleration in benefits and negative real wages send different signals. Central banks will not decide on policies based on just one quarter's data ECI, nor should companies use the overall index as a formula for salary increases for the next year. It is more like a cost thermometer that needs to be read in conjunction with productivity, recruitment, prices, and profit margins.