











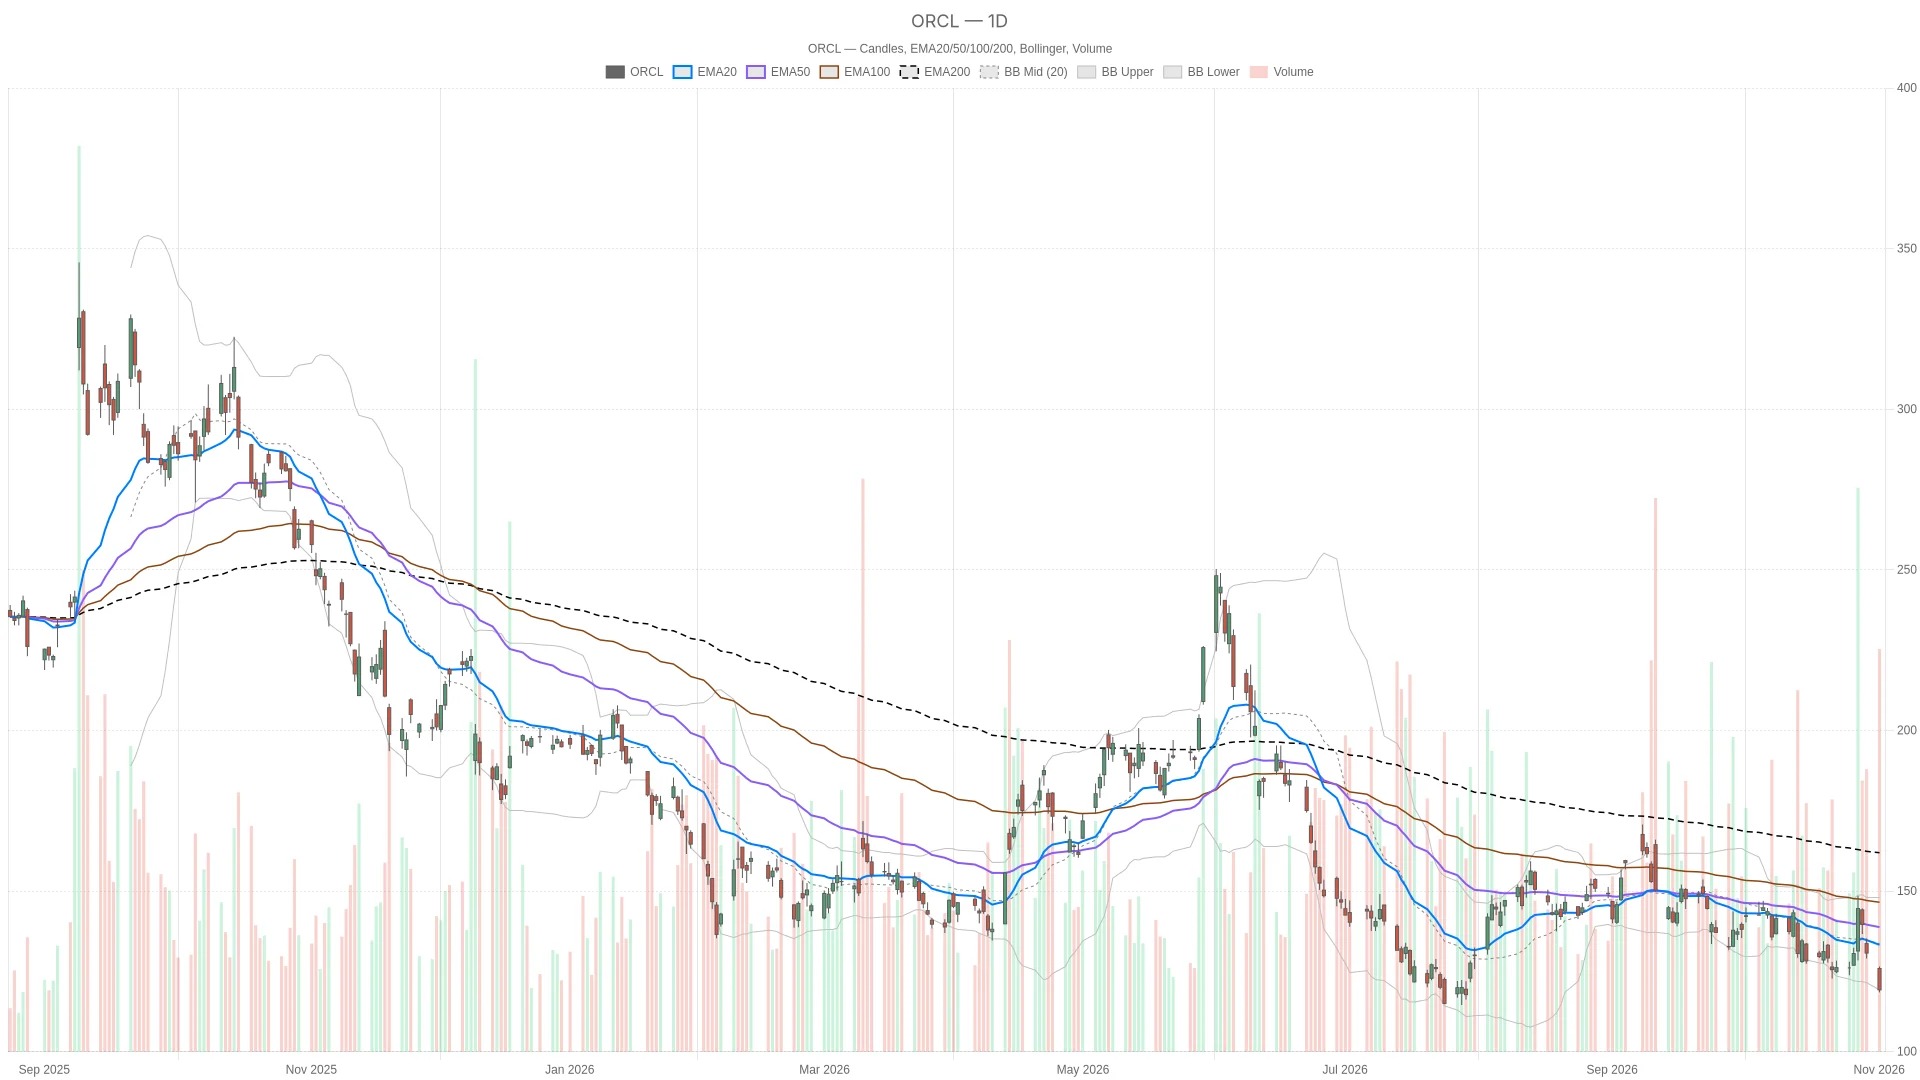
The daily chart structure of Oracle's stock is bearish, with the closing price approaching the lower band of the Bollinger Bands and below the three-day moving averages. The hourly chart readings are in an oversold zone, which complicates the situation further. However, the positive MACD bar on the 15-minute chart is merely a signal at a single point in time and does not constitute a confirmation of a bullish trend at the daily chart level.

On Monday, November 2, 2026, Oracle opened at $125.88, hit a low of $118.43 during the session, and a high of $126.50, closing at $119.22. The previous closing price was $130.67. A total of 58,484,300 shares were traded on that trading day.
Key Points
- The daily line RSI14 is at 38.34, the daily line MACD bar chart shows -0.09, and the MACD line is at -3.26, which is below the signal line of -3.17.
- The closing price was only slightly higher than the lower band of the daily Bollinger Bands at $119.19, and it was also below the 20-day EMA at $133.24, the 50-day EMA at $138.74, and the 200-day EMA at $159.50.
- The hourly line RSI14 is at 26.03, which is in an oversold range; the hourly line MACD is at -3.62, which is below the signal line of -2.05.
- The 15-minute MACD bar chart shows a value of 0.11, while the MACD line shows -2.13, which is higher than the signal line of -2.24; however, the price is still below the middle band of the 15-minute Bollinger Bands at 121.26 USD.
Oracle's stock faces a bearish daily chart structure
The daily moving averages are arranged in a bearish trend. The price is below the 20-day EMA of $133.24, followed by the 50-day EMA of $138.74 and the 200-day EMA of $159.50. This arrangement supports a bearish outlook, as all three moving averages are above the closing price.
Meanwhile, the daily RSI14 indicator is at 38.34, which is below the neutral level of 50, but it has not yet entered an oversold zone. The daily MACD bar chart has dropped from 0.86 on the previous trading day to -0.09, and the MACD line is at -3.26, which is lower than the signal line of -3.17, confirming a bearish momentum in the daily chart.
The closing price is not far above the lower band of the daily Bollinger Bands at $119.19. The middle band is at $133.57, and the upper band is at $147.95, indicating that the price is closer to the lower edge of the range rather than the middle position. The daily ATR14 has risen to $7.96, higher than the previous $7.64, suggesting that the average range of fluctuations is larger than the previous reading.
Weak hourly charts coexist with mixed execution signals.
Similarly, the hourly chart also confirms a bearish trend on the daily chart. The closing price is below the 20-period EMA at $127.34, the 50-period EMA at $129.92, and the 200-period EMA at $135.89; all of these moving averages are also in a bearish alignment.
However, the hourly chart RSI14 shows a value of 26.03, which is in an oversold area. The hourly chart MACD still shows a negative value of -3.62, which is lower than the signal line of -2.05; its bar chart indicates -1.57. Therefore, both oversold readings of RSI and slightly bullish readings of MACD exist simultaneously, rather than forming a bullish reversal.
In contrast, on the 15-minute chart, the MACD line at -2.13 is higher than the signal line at -2.24, forming a positive bar of 0.11. The 15-minute RSI14 is still in an oversold zone, at 28.07. The price is still below the 15-minute Bollinger Bands middle band of $121.26 and the 20-period EMA of $121.45; therefore, the evidence for a bullish outlook is limited to timing signals at the execution level only.
Post-market news pertains to the situation after the market closes.
Long and short conditions for the next trading session
When trading resumes, the daily pivot point is at $121.38, with the first resistance level at $124.34 and the first support level at $116.27. In terms of execution timing, the 15-minute pivot point is at $119, with the first resistance level at $119.56 and the first support level at $118.55. The closing price on Monday was above the 15-minute pivot point but below its first resistance level.
In a bullish scenario, if the price breaks through the first resistance level of $119.56 within 15 minutes, that will provide initial support. Reaching the daily pivot point of $121.38 will offer even stronger support, and if it then breaks through the first daily resistance level of $124.34, that will further strengthen the bullish trend. Nevertheless, the 20-day moving average of $133.24 will still pose a challenge above.
On the contrary, if it falls below the first support level of $118.55 over a 15-minute period as well as the intraday low of $118.43, that would weaken the bullish scenario. At that point, the first support level on the daily chart, which is $116.27, would become the next reference for downward movement. These are all conditional thresholds, not predictions.
Overall, Oracle's stock price is near the lower band of the daily Bollinger Bands, below the daily pivot point for the next trading session, and also below the bearish arranged daily moving averages. The daily ATR14 level is at $7.96, which defines the range of fluctuations. What remains to be seen is whether the positive MACD signal on the 15-minute chart can be supported by the hourly and daily charts.
Frequently Asked Questions
What is the technical analysis of Oracle's stock on a daily basis?
Oracle's stock shows a bearish daily chart structure. The closing price of $119.22 is lower than the three moving averages of the daily charts: the 20-day EMA at $133.24, the 50-day EMA at $138.74, and the 200-day EMA at $159.50. The daily RSI14 is at 38.34, and the daily MACD line is below the signal line.
Are there any positive signs for Oracle's stock?
The 15-minute MACD bar chart shows a value of 0.11, and the MACD line shows -2.13, which is higher than the signal line of -2.24. However, the price is still below the middle band of the 15-minute Bollinger Bands at 121.26 USD. On the hourly chart, the RSI14 indicator shows 26.03, indicating an oversold area, while the MACD indicator on the hourly chart remains bearish.
What key levels need to be watched for in the next trading session?
The daily pivot point is at $121.38, with the first resistance level at $124.34 and the first support level at $116.27. On the 15-minute chart, the pivot point is at $119, with the first resistance level at $119.56 and the first support level at $118.55. The lower band of the daily Bollinger Bands is at $119.19.
Disclaimer
This article is for informational purposes only and does not constitute financial advice, investment advice, or an offer or invitation to buy or sell any financial instruments. The analysis provided does not represent future results. Investing in the financial market carries a high risk of capital loss. Before making any decisions, please be sure to conduct your own research ( DYOR ) and consult a qualified financial advisor.
Cryptonomist and the author do not hold any positions in the financial instruments mentioned in this text, nor have they received any compensation from the companies reported.
This article was generated with the assistance of artificial intelligence and has been reviewed by an editorial team.
Lorenzo Marcek
Lorenzo Marcek is a financial journalist and senior crypto market analyst, renowned for his clear, data-driven reporting on digital assets. With a background in economics and over a decade of experience covering global markets, he focuses on on-chain indicators, institutional adoption trends, and crypto market fluctuations driven by macroeconomic factors. His work combines investigative journalism with technical market insights, making him a trusted source for traders seeking solid, actionable analysis.