











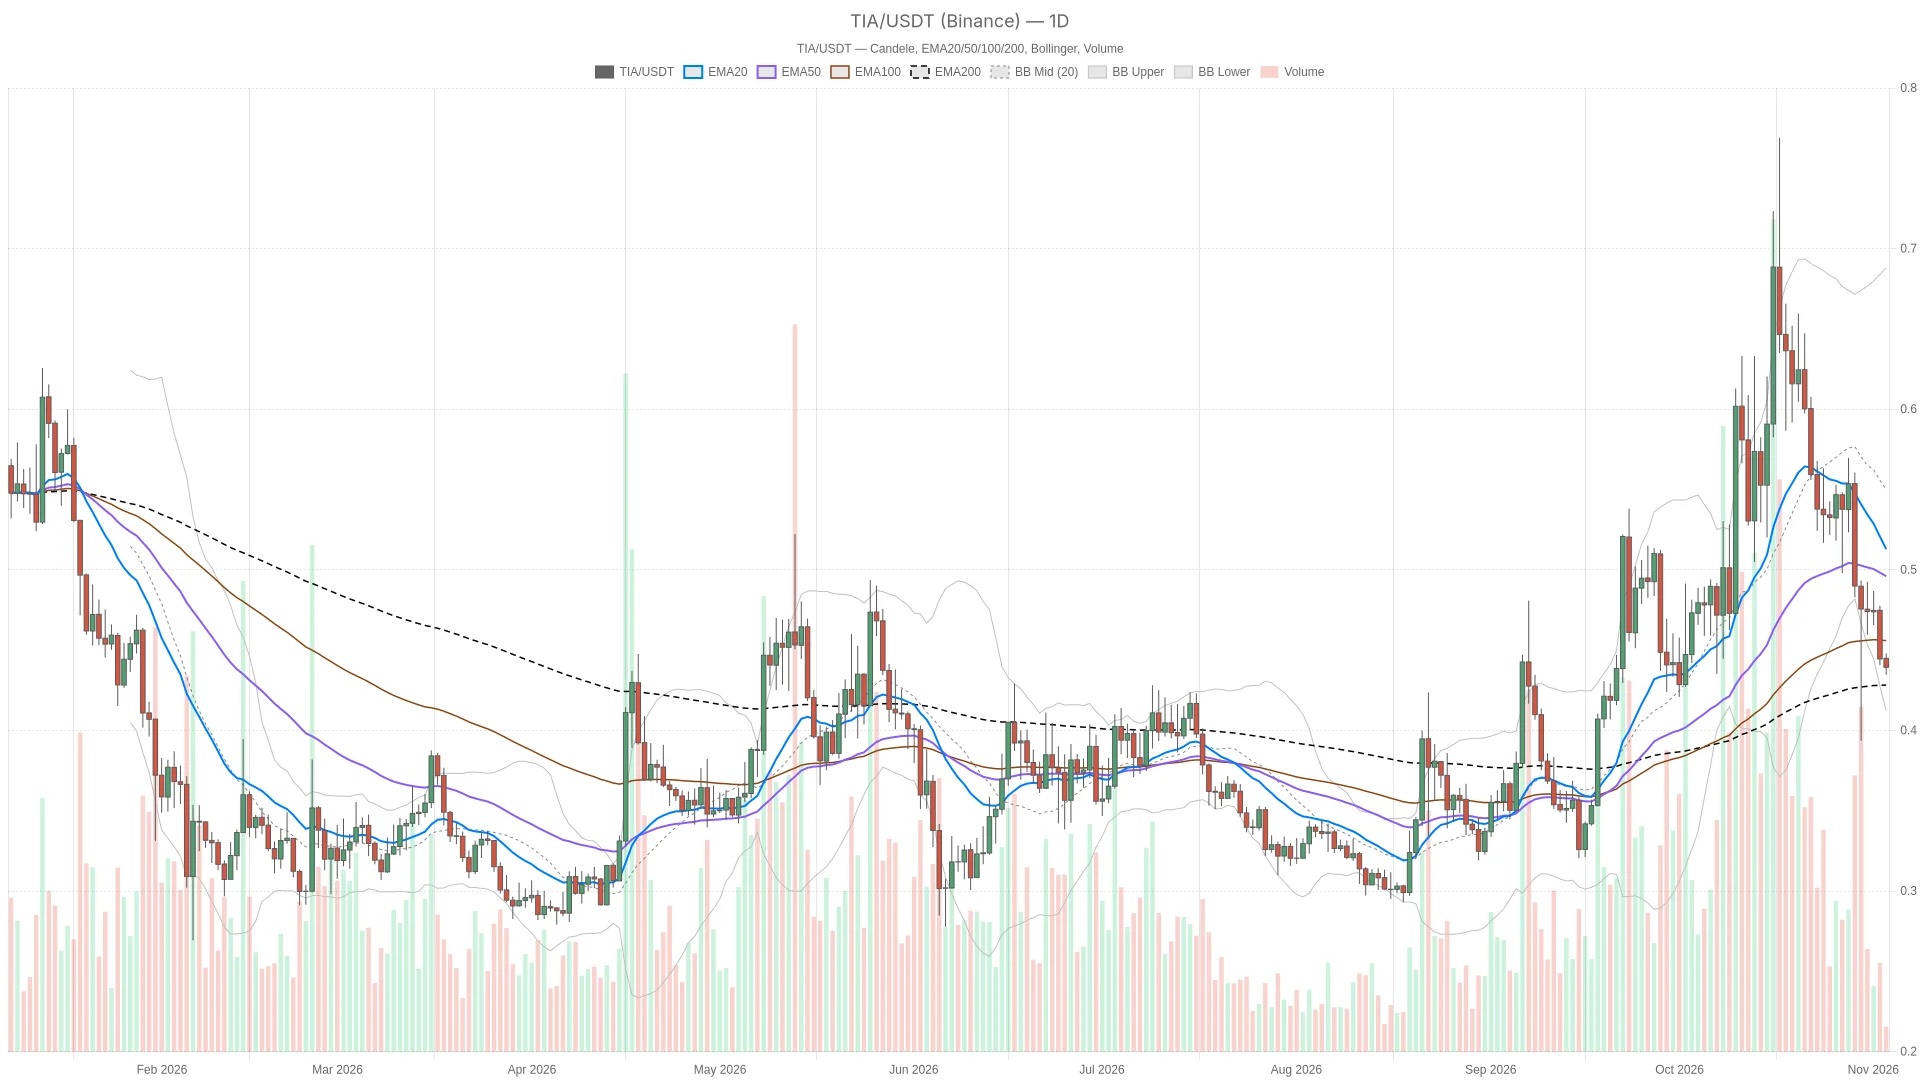
As of November 3, 2026, the price of Celestia on Binance against USDT is $0.4393, indicating a neutral daily chart structure with a slightly bearish hourly trend. The main scenario is neutral but with a defensive approach: the price is still above the daily EMA200 level, but below the daily EMA20 and EMA50 levels.
Key Points
- TIA trades at $0.4393, higher than the daily average of $0.4281 for EMA200, but lower than the daily averages of EMA20 and EMA50.
- The total market value of cryptocurrencies is $2.58 trillion, with a 3.96% decline in 24 hours, and Bitcoin accounts for 59.87%.
- The hourly RSI is in a oversold state, at 28.8, but the daily RSI is at 37.3; no reversal has been confirmed yet.
- To create a stronger recovery scenario, the daily close needs to exceed the daily pivot point of $0.4542.
The current most direct confrontation is between the hourly oversold rebound and the still unclear downward trend on the daily chart. The short-term momentum has left room for a rebound, but the larger structural patterns are not yet sufficient to classify this rebound as a reversal.
The market contraction provided a defensive backdrop for the repair attempts of TIA.

The broader crypto market has not been favorable for the repair attempts of TIA. Data from CoinGecko shows that the total market value of cryptocurrencies is 2.58 trillion US dollars, with a decline of 3.96% in the past 24 hours, and Bitcoin accounts for 59.87% of that value. This context supports a cautious interpretation of the repair attempts for TIA, but it does not explain the reasons for its price fluctuations.
The Fear & Greed Index for Alternative.me is 26, which falls within the “Fear” range. Therefore, market sentiment has hardly provided any confirmation for a broader risk appetite. However, it is also impossible to determine whether TIA has managed to hold the nearby support levels.
Celestia The price holds above the daily line EMA200, but the hourly structure remains bearish.
The daily structure of TIA is damaged but not destroyed, as the price is still above the daily EMA200, and it also lies below the shorter-term moving averages. Binance candlestick data shows that TIA is below the daily EMA20 at $0.5207 and the daily EMA50 at $0.4983, but it is still above the daily EMA200 at $0.4281. Therefore, the daily chart presents a structure that has been damaged but has since repaired itself, rather than a complete breakdown after falling below all the major moving averages.
Maintaining the longest-term moving average preserves a neutral macro-level judgment; to return to a shorter-term moving average, the current rebound strength needs to far exceed it. However, the hourly chart is not so forgiving: prices are below the hourly EMA20 of $0.4447, EMA50 of $0.4561, and EMA200 of $0.4920, with the moving averages indicating a bearish trend. This indicates that the current immediate trend is still weaker than the daily context.
At the same time, merely from an execution perspective, the price is higher than its EMA20 of $0.4384 after 15 minutes, but lower than EMA50 at $0.4413 and EMA200 at $0.4560. These moving averages also maintain a bearish alignment. The shortest time frame shows only a preliminary recovery, rather than a structural confirmation that aligns with a bullish reversal.
Hourly oversold momentum provides room for a rebound, but there is no confirmation on the daily chart.
The hourly rebound lacks confirmation from the daily time frame, while the daily momentum indicators still point downward. The daily RSI continues to decline to 37.3, and the daily MACD bar chart remains negative, with a recent trend that has been flat. Both factors indicate that the downward pressure has not yet eased: there is no change in momentum at the daily level to validate a short-term recovery.
The hourly RSI indicator is in a state of oversold at 28.8, but the hourly MACD bar chart has crossed above the zero axis and continues to rise. These signals are in constructive conflict with each other rather than being clearly consistent: even if selling pressure diminishes, prices may still be trapped within a bearish trend. The 15-minute RSI indicator is at 46.3 and shows a downward trend among the given completed readings; its MACD bar chart is positive but flat. Further follow-up remains unstable.
In addition, the Bollinger Bands range on the daily chart is from $0.4277 to $0.6839, with the middle band at $0.5558. The price being close to the lower band further strengthens the defensive outlook on the daily time frame. On the hourly chart, the lower band is at $0.4312 and the upper band is at $0.4575; the middle band represents the first resistance level mentioned below.
The correction towards this mid-track is still merely a mean reversion within a weak structure. The daily ATR level is $0.05616, while the hourly ATR level is $0.004865. These ranges of fluctuation mean that small price crossings observed during individual chart analyses are not particularly convincing: a brief breakthrough of a certain pivot point does not equate to a breakout at the candlestick level.
The daily pivot level of $0.4542 will separate the risk of a rebound from the continued downward trend.
Only when the daily closing price reclaims the pivot point of $0.4542 will the outlook shift from neutral defense to a genuine attempt at recovery. The current real-time hourly price of $0.4394 is already above the hourly R1 level of $0.4392, making this level more of a support near the current price rather than a resistance to be broken through. The hourly pivot points of $0.4380 and $0.4368 (from S1) are located below this. However, the last completed hourly candlestick closed at $0.4379, which is below the hourly pivot point, so the current reclamation of this level has not yet been confirmed. The nearest upper resistance is at the middle band of the hourly Bollinger Bands, which is $0.4443.
Bullish scenario: If the daily close exceeds the daily pivot point of $0.4542, it will form a stronger recovery scenario. The next resistance level is $0.4679, which corresponds to the daily R1. However, if the daily close falls below $0.4309, which is the daily S1, then this scenario will no longer hold. Before the triggering conditions are met, any rebound at TIA should be considered more of a counter-trend attempt rather than a confirmed daily reversal.
Bearish scenario: If the daily close falls below the daily S1, then the neutral daily outlook will turn bearish, and the price will be exposed to the daily EMA200. Subsequently, it will reach the lower band of the daily Bollinger Bands. However, if the daily close manages to rebound above the daily pivot point later on, then this bearish setup will become invalid. The nearby daily support levels do not automatically imply a clear downward continuation; instead, there is uncertainty.
However, the most likely false signal is when the price breaks through the hourly R1 level during the session and is mistakenly interpreted as a change in trend. The hourly MACD momentum turns positive, supporting a rebound, but the price is still below all hourly EMA levels; the daily line ATR also indicates that there could be a sharp reversal around these price levels.
Frequently Asked Questions
Is the main trend for TIA bullish or bearish?
The daily chart indicates a neutral trend with a defensive tendency. The price is still above the daily level of EMA200, but below the daily levels of EMA20 and EMA50. However, the hourly structure suggests a bearish outlook.
Has the hourly RSI overselling confirmed the bottom?
No. The hourly RSI value is 28.8, accompanied by a rising bar chart of MACD, but there is still no confirmation of a reversal in the daily momentum indicators.
This article was generated with the assistance of artificial intelligence and has been reviewed by an editorial team.
Lorenzo Marcek
Lorenzo Marcek is a financial journalist and senior crypto market analyst, renowned for his clear, data-driven reporting on digital assets. With a background in economics and over a decade of experience covering global markets, he specializes in on-chain indicators, institutional adoption trends, and macroeconomic factors that influence cryptocurrency volatility. His work combines investigative journalism with technical market insights, making him a trusted source for traders seeking solid, actionable analysis.