














Key Points
- After falling below the target price of $2,309, Ethereum ( ETH ) has once again managed to regain the $2,300 level; this level had previously been lost due to a $6.3 billion Binance hacking incident last week.
- U.S. spot Ethereum ETF recorded capital outflows for the seventh consecutive trading day on Tuesday.
- ETH Currently, the support level is at $2250, followed by $2204 and $2107; if it can regain the range between $2309 and $2355, the short-term outlook may improve.
Ethereum ( ETH ) returned above $2,300 on Wednesday, with a cumulative increase of over 2% in the past 24 hours.
This second-largest cryptocurrency by market value has yet to recover the price of $2,309. This level is a closely watched indicator on the blockchain, representing the average holding cost calculated for ETH based on its most recent transfer price on the blockchain.
After a $6.3 billion Binance security vulnerability occurred last Thursday, Ethereum fell below this threshold, triggering new uncertainties in the cryptocurrency market.
The failure to regain that level is also related to the continuous outflow of funds from the US spot Ethereum exchange-traded fund ( ETF ), which has further deepened market concerns about institutional demand.
Although ETH still holds the support around $2,250, technical indicators show that sellers are still in the upper hand.
Ethereum approaches $2,309 to achieve that price level
Ethereum's recent price trend highlights the importance of achieving a certain price level, and currently, this indicator is estimated to be $2309.
According to CryptoQuant data, ETH fell below this level after the Binance hacking incident and has struggled to recover over the past two days.
The realized price is calculated by dividing the price of the token at its last movement on the chain by the total supply of that token.
It is usually used as an approximation of the overall market cost base, but it does not reflect the actual purchase price of each individual investor.
When the asset trading price is higher than the realized price, the market is generally considered to be in a state of unrealized profit overall.
Falling below this indicator means that the average on-chain cost base is higher than the current market price.
During periods of uncertainty, this can affect investor behavior. Before the decline last Thursday, Ethereum had been trading above its target price for over a week, with buying pressure managing to hold this level on several occasions.
However, the recent losses have changed the short-term market structure. ETH encountered resistance around $2,309 during the rebound attempt, indicating that some investors are taking the opportunity to reduce their positions as the price returns near their cost basis.
If it can continue to rise above the implementation price, that would be a positive sign, possibly indicating that buying demand is on the rise.
Institutional demand remains another major concern for Ethereum. According to SoSoValue data, US-listed spot Ethereum ETF saw a net outflow of nearly 85 million US dollars on Tuesday, marking the seventh consecutive trading day of capital withdrawal.
Sustained capital outflows indicate that investors are reducing their exposure to ETH through regulated investment products.
Ethereum holds above $2,250, bulls slowly regain control
The daily technical outlook for Ethereum is slowly turning bullish, but ETH is still below several important exponential moving averages ( EMA ).
On the 20th, EMA was at $2,352, and on the 100th, EMA was at $2,345. Both are close to the resistance level of $2,355, forming a concentrated supply zone that may limit any attempt at a rebound.
On the 50th day, EMA is at $2,411, posing another significant resistance level. ETH being below these moving averages indicates that the short to medium-term trend is still under pressure.
The momentum indicator also supports this cautious judgment. On the 14th, the Relative Strength Index ( RSI ) was around 39, which is below the neutral level of 50.
Meanwhile, random indicators approaching 34 indicate that the upward momentum remains limited.
Overall, these indicators suggest that buyers have not yet regained clear control over the market.
ETH The current immediate support level is at $2,250. If this level can be maintained, ETH may consolidate and attempt to rise back to the target price of $2,309 again.
However, if the daily chart closes clearly below $2,250, it will weaken the short-term technical structure and make $2,204 the next support level.
If selling pressure intensifies, Ethereum could further decline to $2,107. A deeper pullback could bring the structural support levels of $1,971 and $1,827 into focus.
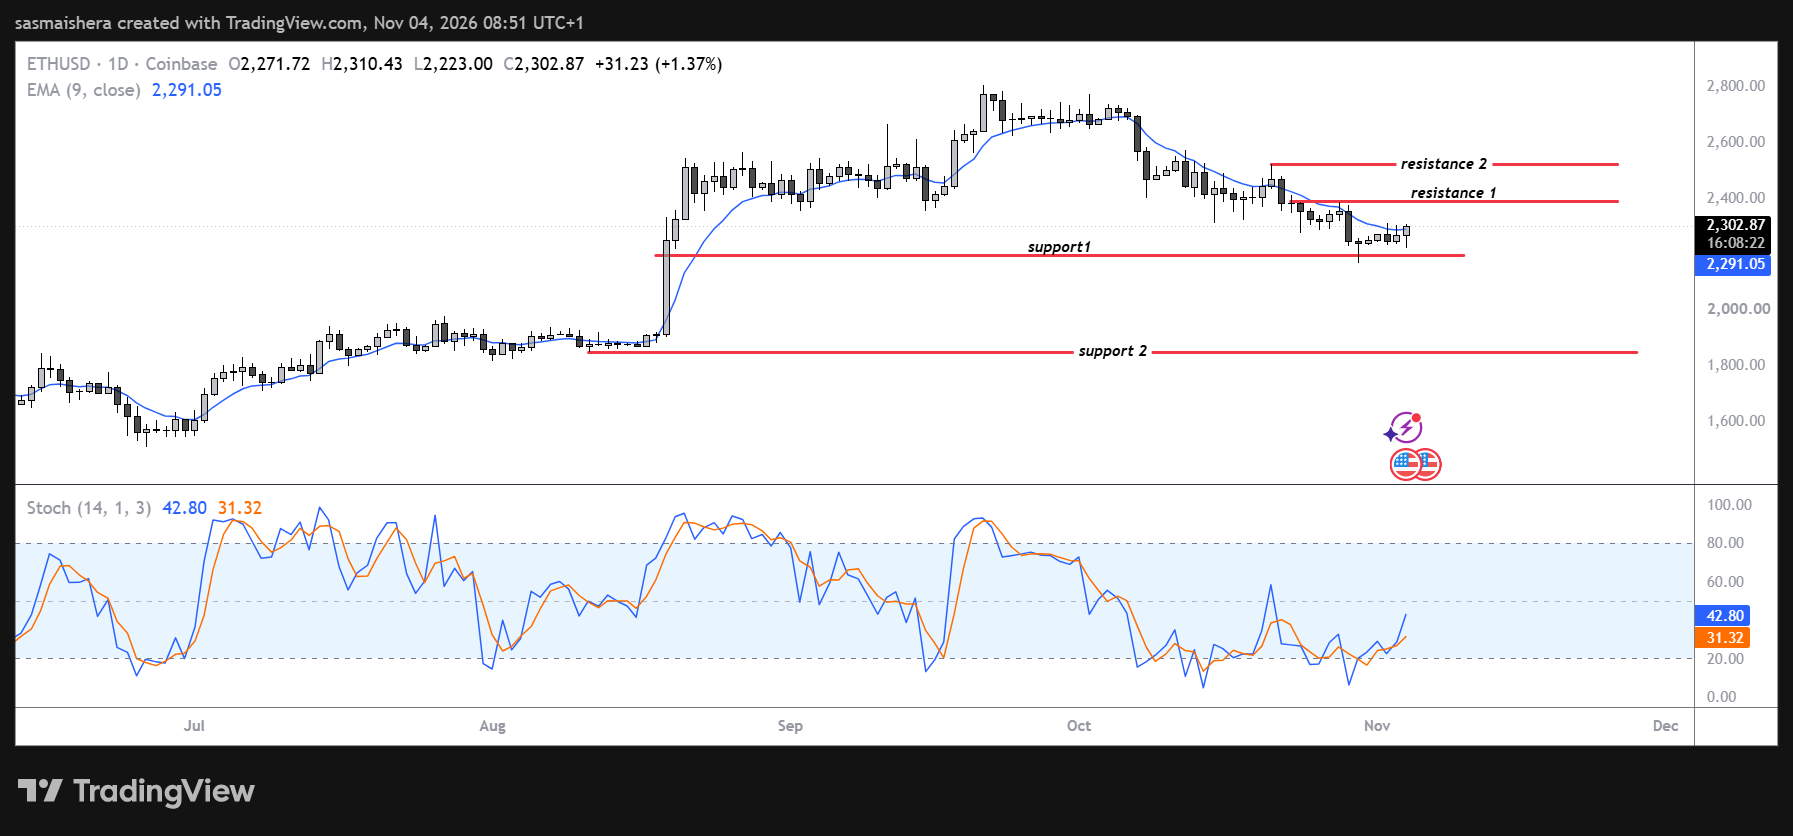
On the upside, buyers first need to regain the $2,309 level in order to improve the current outlook.
The next major resistance zone is between $2,345 and $2,355, where the 100-day and 20-day EMA moving averages converge with the horizontal resistance level.
If it can continue to break through this area, it may push prices back up to the 50-day EMA of $2411. Further upwards, the other resistance levels are at $2548, $2636, and $2781 respectively.