











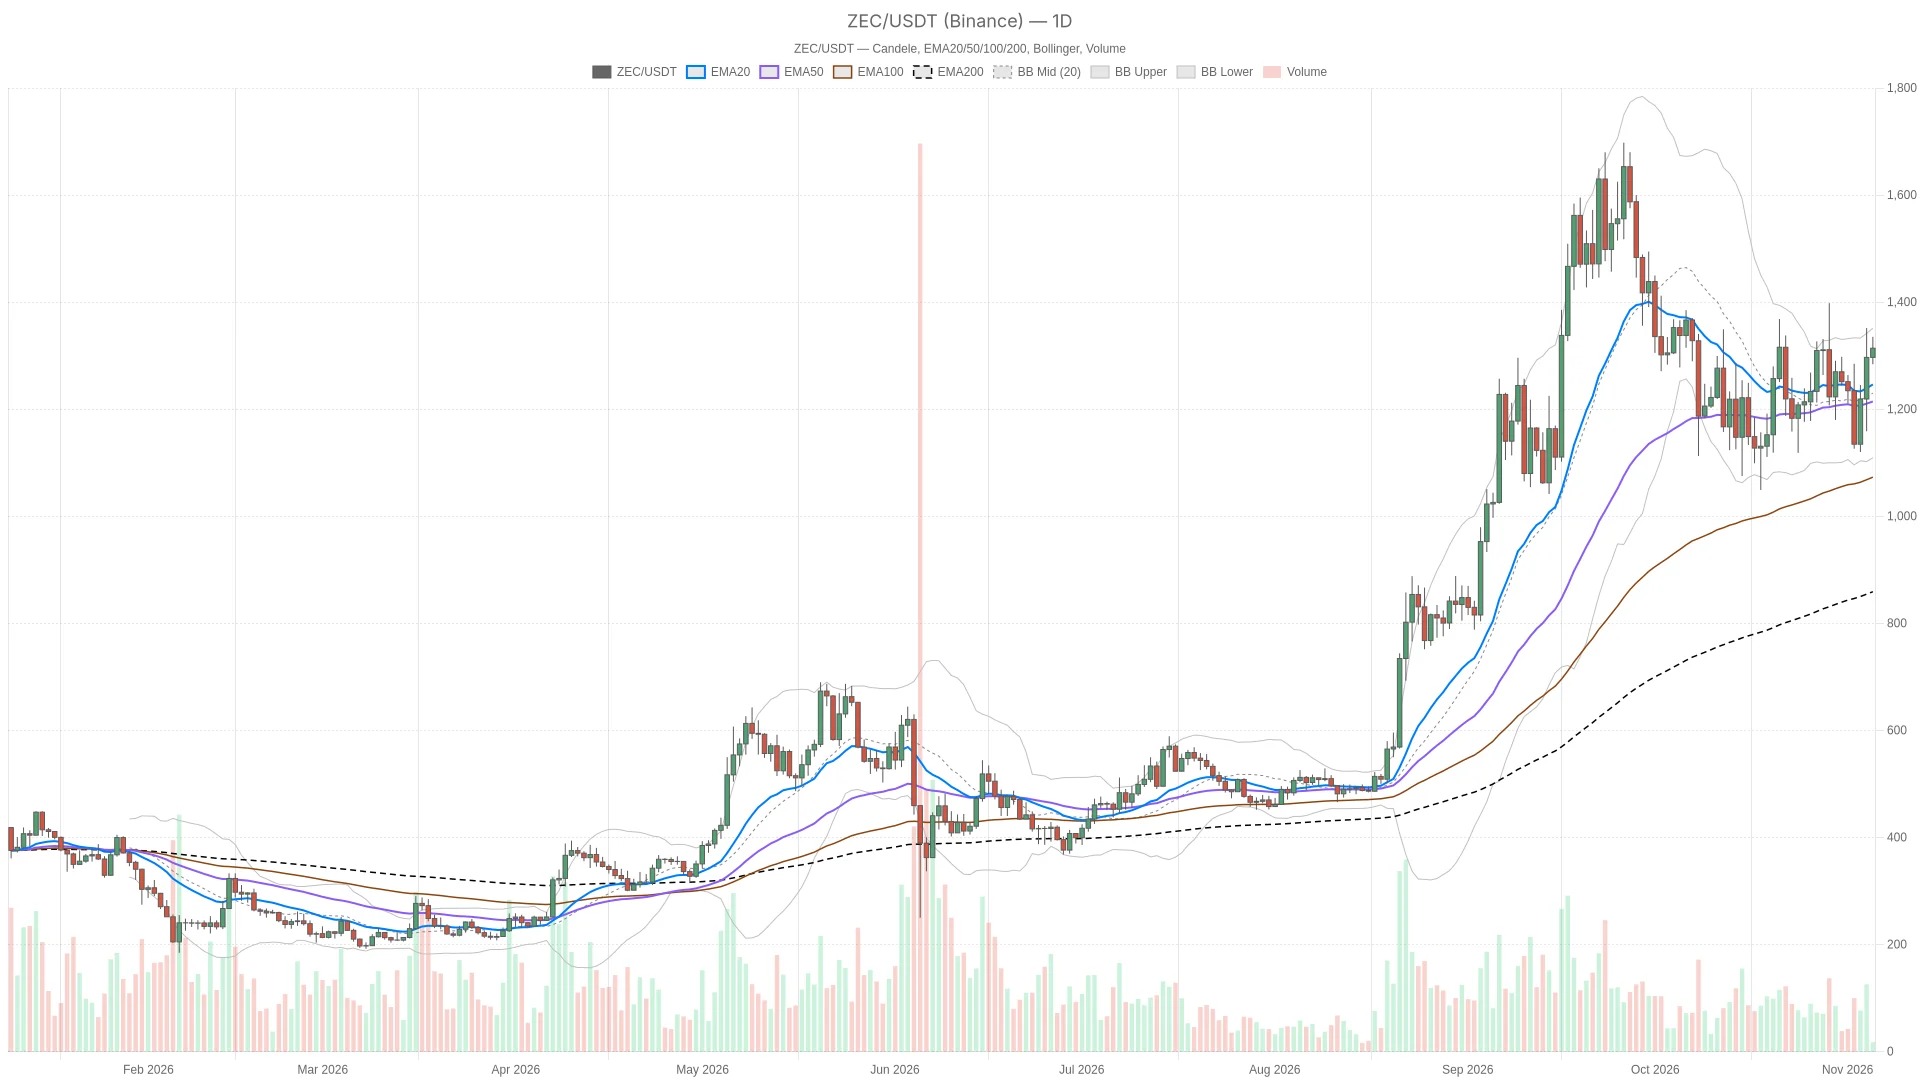
As of November 5, 2026, the trading price of Zcash on Binance was $1,313.92, with an overall bullish bias. The daily momentum has turned positive, but the readings for shorter time frames are not as convincing. A continuation of the trend is still the main scenario; however, a immediate breakout has not been confirmed yet.
Key Points
- Zcash reports $1,313.92, with a bullish bias on the daily chart supported by the alignment of moving averages.
- The daily resistance level is at $1,341.64 (the upper band of the Bollinger Bands); if the closing price stays above this level, the target will be $1,379.26.
- The bar chart for MACD during the session still shows negative values, which weakens the argument that prices will continue to rise all the way.
- A pending $16 million privacy pool freeze event provides some context, but there is no evidence to suggest a causal relationship with prices.
Zcash The price still maintains a bullish bias on the daily chart despite short-term hesitation.
The daily chart supports a continuation of the upward trend, while the hourly chart can only partially confirm this. Both charts maintain a bullish moving average structure, but the MACD bar chart on the hourly chart shows negative values. This divergence suggests that there may be a pullback in prices, but it does not indicate that the larger-scale trend is weakening.
The 15-minute chart is only used for execution-level judgment. The price is below EMA20, but above EMA50 and EMA200, therefore the immediate strength is weaker than that of larger-scale structures. To transform the daily trend back into an upward momentum, a short-term rebound requires more than just a positive movement.
Moving averages indicate a supportive trend, but fluctuations still leave room for pullbacks.
On the daily chart, the price is above $1,239.11, which is EMA20, $1,210.33, which is EMA50, and $854.52, which is EMA200. These moving averages are arranged in a bullish pattern. This is currently the clearest structural evidence indicating that the current hesitation cannot yet be considered a confirmed trend reversal.
The hourly chart also shows that the price is above three moving averages: EMA20 at $1,302.33, EMA50 at $1,270.78, and EMA200 at $1,244.38. Their bullish arrangement has maintained the medium-term trend, but the more recent moving averages present a more direct test, rather than the distant support provided by the daily moving averages.
On the 15-minute chart, EMA20 is at $1,318.86, which is higher than the current price. EMA50 is at $1,311.94, and EMA200 is at $1,272.11, still below; therefore, the moving average structure remains bullish. However, the price has not crossed above the entire set of moving averages, which reflects weakness at the execution level, rather than a standalone macro sell signal.
The upper band of the daily Bollinger Bands at $1,341.64 is the nearest daily resistance level, with the middle band at $1,221.96 and the lower band at $1,102.28. Zcash is located in the upper half of this range but has not yet broken through the upper edge. The current pattern is conducive to testing the resistance level, but it does not yet indicate an upward expansion.
The daily line ATR is at $117.16, the hourly line at $23.04, and the 15-minute line at $8.44. These readings help to understand the distances between prices during consecutive trading sessions. A brief crossing of a certain level may simply be part of normal K-line fluctuations and should not be automatically interpreted as a structural change.
RSI supports daily line repairs, while MACD exposes intraday divergences.
The situation for MACD is also showing a divergence. The daily bar chart has risen from below the zero axis to the positive territory, although the line for MACD itself is still negative. This indicates that momentum is improving, but it cannot yet be considered a unconditional breakout signal.
The hourly chart bar graph shows negative values, and the recent readings are mixed; the 15-minute chart bar graph also shows negative values, with a relatively flat trend recently. Neither of these is sufficient to support the claim that "downward momentum is accelerating," but they do reduce the likelihood of prices continuing to rise unilaterally. There is both a daily line chart recovery and hesitation during trading hours, so the signals indeed conflict with each other.
The daily resistance level of $1,341.64 will continue to distinguish between unconfirmed rebounds and confirmed reversals.
Bullish scenario: If the daily close exceeds the upper band of the daily Bollinger Bands at $1,341.64, it will confirm a breakout above the recent daily resistance level. Subsequently, the daily R1 level of $1,379.26 will come into view. If the daily close falls below the daily pivot point of $1,269.07 afterward, this continuation pattern will be invalidated. The most likely false signal would be a temporary breakout above the upper band during the session, but the price fails to hold above that level by the time of the daily close.
Before confirmation on the daily chart, the hourly resistance levels start at $1,317.21 at hour S1. Following that is the hourly pivot point of $1,322.43, and above that is $1,328.80 at hour R1. Although the first level is labeled as S1, it actually acts as resistance since it is above the current hourly price. These are independent resistance levels, and their presence does not indicate that a breakout on the daily chart has occurred.
Bearish scenario: If the hourly close falls below the middle band of the hourly Bollinger Bands at 1,306.35 USD, it will confirm a loss of local support. Subsequently, the hourly support level of 1,302.33 USD will be tested, followed by the lower band of the hourly Bollinger Bands at 1,276.79 USD. If the hourly close manages to rebound above the hourly support level of 1,317.21 USD later on, this bearish pattern will become invalid. The main risk with this scenario is that there could be a brief break below support followed by a quick rebound, while the daily trend remains bullish.
This bearish scenario describes a pullback, rather than an automatic reversal on the daily chart. The daily pivot point remains a more significant structural observation point. Since the daily ATR level is at $117.16, a weakening during the session can coexist with a generally bullish daily trend. The key uncertainty lies in whether the local selling pressure will be contained, or whether it will further test support at a larger level.
Privacy pool freezing provides a context, but it is not a confirmed explanation for price changes.
Zcash plans to freeze $16 million from its earliest privacy pool. This upcoming event provides a non-technical context for the chart. However, the information provided does not indicate its impact on liquidity or prices. It cannot be described as the reason for a daily line repair or indecision during trading hours.
Neutral emotions do not provide a clear direction for confirmation.
The Fear & Greed Index for Alternative.me is 50, which is classified as neutral. This background indicates neither extreme fear nor extreme greed, and therefore cannot provide additional confirmation for the trend of ZEC.
CoinGecko It shows that the total market value of cryptocurrencies is $2,706,733,795,867.32, with Bitcoin holding a dominant position of 59.52%. These are reference levels for the entire market and do not indicate any directional change in dominance, nor do they prove that funds are shifting into ZEC.
Frequently Asked Questions
Why is the main scenario still bullish when MACD is negative during the session?
The main trend is determined by the daily time frame: the daily moving averages are in a bullish arrangement, and the bar chart has turned positive. The negative values in the bar chart during trading hours are merely corrections to the ongoing trend, not enough to overturn the daily structure on their own.
Can the privacy pool news explain the current trend?
No. The information provided does not establish a causal relationship. This event is part of the relevant background, but attributing price fluctuations to it goes beyond the existing facts.
This article was generated with the assistance of artificial intelligence and has been reviewed by an editorial team.
Lorenzo Marcek is a financial journalist and senior crypto market analyst, renowned for his clear, data-driven reporting on digital assets. With a background in economics and over a decade of experience covering global markets, he specializes in on-chain indicators, institutional adoption trends, and macroeconomic factors that influence cryptocurrency volatility. His work combines investigative journalism with insights into the technology market, making him a trusted source for traders seeking solid, actionable analysis.