












Ethereum prices have fallen by more than 8% in the past 24 hours, dropping to around $2,200. The reasons include a decline in U.S. tech stocks, an increase in cryptocurrency liquidations, and a resumption of capital outflows from spot ETH exchange-traded funds (ETFs).
Ethereum fell by more than 8%, and the negative sentiment among tech stocks spread to the cryptocurrency market.
CoinGlass data shows that the Ethereum liquidation amount reached $210 million, of which $179 million came from leveraged long positions.
On November 5th, US spot Ethereum ETF recorded a net outflow of nearly $100 million in a single day.
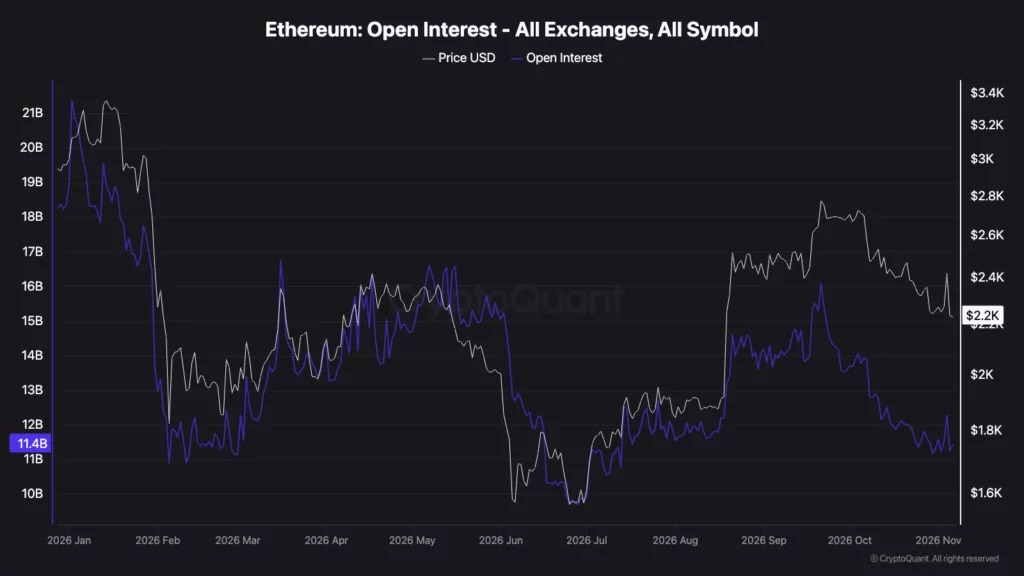
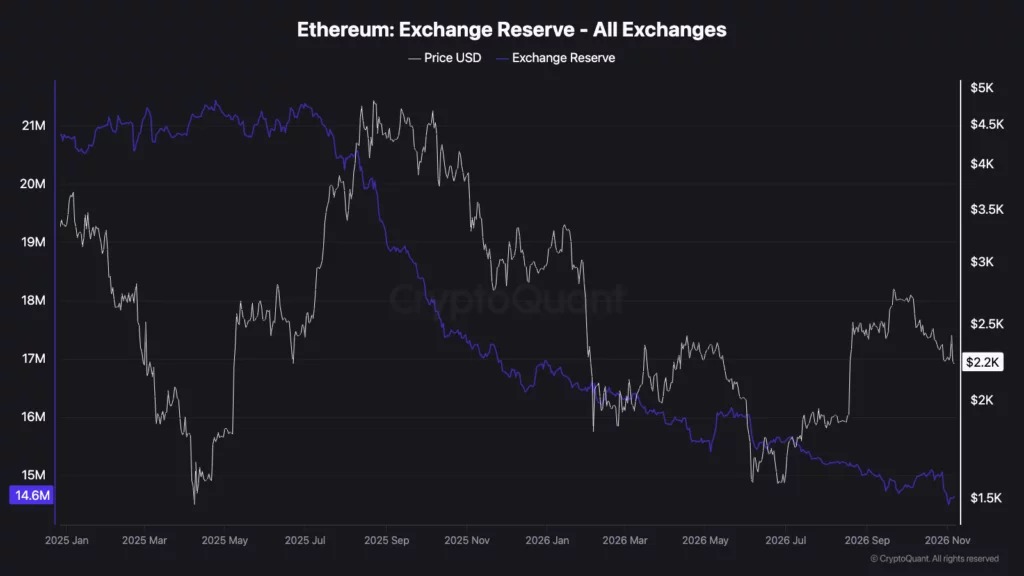
Ethereum exchange reserves have dropped to around 14.6 million ETH, while the number of open derivative contracts continues to decline.
The short-term support level for Ethereum is around $2,200. With RSI below 40, it indicates that the buying momentum remains weak.
According to crypto.news market data, the trading price of Ethereum on November 6 was approximately $2,220, with a decline of about 8.3% within 24 hours. Bitcoin fell by 6.1%, approaching $75,500. As investors reduced their exposure to high-risk assets, the total market value of cryptocurrencies also decreased.
Tech stocks falling dragged down Ethereum, causing it to weaken.
The selling of U.S. tech stocks coincided with a weakening in cryptocurrencies, including Ethereum and Bitcoin. Investors are concerned about rising borrowing costs, expenditures on artificial intelligence infrastructure, and the expected returns on these investments.
It is worth noting that this round of selling occurred after a brief rebound following the mid-term elections on November 3rd, when the Democratic Party gained control of both houses of Congress. However, the subsequent decline affected a variety of major cryptocurrencies, and XRP and Solana also recorded significant declines on that day.
Market sentiment weakened during this round of selling. Crypto Fear and Greed Index dropped to 28 on November 6th, from 50 the previous day. Last week, the index was at 30, and a month ago it was at 71.
This decline shifted market sentiment from a neutral reading the previous day into a fear zone.
Leveraged positions were liquidated, accelerating the decline of Ethereum.
During the downward price trend, derivatives trading further put pressure on Ethereum, with exchanges continuously closing leveraged positions that were contrary to the price movement.
According to CoinGlass data, Ethereum recorded over $210 million in liquidations within 24 hours. Long positions accounted for $179 million, indicating that traders who bet on price increases suffered the greatest losses in forced closings.
The total liquidation amount in the entire cryptocurrency market exceeded $1 billion, due to the simultaneous decline of Bitcoin and other major assets. Forced liquidations occurred when traders no longer had sufficient collateral to maintain their leveraged positions.
This decline indicates that the number of open contracts in the market is decreasing. Open contracts do not distinguish between long or short positions, but a decrease in open contracts alongside a drop in prices usually accompanies the closing of those positions.
Previously, crypto.news reported that during the market decline in October driven by inflation data, Binance's Ethereum liquidations exceeded $106 million in just one hour.
Ethereum ETF funds flow out close to 100 million US dollars
On November 5th, the flow of institutional funds turned back to net outflows, putting additional pressure on Ethereum.
According to SoSoValue data, US spot Ethereum ETF recorded a net outflow of nearly $100 million, reversing the previous day's net inflow of $53 million.
BlackRock's ETHA had a net outflow of 75.2 million US dollars, while its ETHB fund also saw an outflow of 22 million US dollars. Fidelity's FETH had an outflow of 2.2 million US dollars, and Grayscale redeemed approximately 500,000 US dollars from its ETHE.
Previously, these ETF recorded net outflows of $139.7 million on November 2 and $85.3 million on November 3, respectively.
Meanwhile, according to CryptoQuant data, the reserves of Ethereum exchanges continue to decline. The balance in centralized exchanges has dropped from over 21 million ETH at the beginning of 2025 to approximately 14.6 million on November 6th.
A decrease in exchange balances means that there are fewer tokens in wallets that are classified as exchange reserves. However, withdrawing funds may involve pledging, private custody, or transfers between platforms, and does not necessarily imply a stronger buying demand.
An analysis in October showed that Binance’s reserves decreased by approximately 430,000 tokens between August 25 and October 16.
Ethereum tests 2,200 dollars, RSI remains weak
Ethereum's technical indicators show that despite encountering resistance in the recent range of $2,440 to $2,450, selling pressure still exists.
The Relative Strength Index ( RSI ) is at 38.65, which is below the neutral level of 50 but above the traditional oversold threshold of 30. This indicates that buying momentum is weak, but it cannot yet be confirmed that the downward trend has been exhausted.
The MACD line is at -59.79, slightly higher than the signal line of -60.77. Although the positive bar chart showing 0.98 indicates a slight improvement in momentum, both lines are still below the zero axis.
The immediate support level is around $2,200; if selling continues, the next support area is around $2,000. The resistance level remains around $2,350, with another resistance level around $2,500.
An Ethereum price analysis on November 5th regarded the range of $2,170 to $2,200 as an important support area; previously, the level around $2,240 had been lost by ETH.
If the price rebounds above $2,350, the resistance area around $2,440 seen recently will once again come into focus. If it continues to fall below $2,200, then the support levels at $2,100 and $2,000 will become exposed.
Disclosure: This article does not constitute investment advice. The content and materials on this page are for educational purposes only.