













CoinGlass data shows that in the markets it tracks, a total of $1.05 billion was forcibly liquidated in the past 24 hours, of which 88.2% came from long positions.
Bitcoin once fell to $74,780.91, hitting its weakest intraday price since August 21. On Friday, Bitcoin was traded around $75,570; earlier in the day it reached $74,780.91, which is lower than its intraday low on August 21, 77 days ago.
The decline in the crypto market occurred after a significant sell-off of AI stocks and another round of forced liquidations in the derivatives market.
According to CoinGlass data, a total of 1.05 billion US dollars in crypto assets were liquidated within the past 24 hours. Of this amount, long positions accounted for 930.04 million US dollars, which is 88.2%; short positions amounted to 124.69 million US dollars.
Bitcoin's low point in November
This 80% to 20% margin for forced liquidation also corresponds to the overall sentiment reflected by the Fear and Greed Index. The index is currently at 28 points, which is close to “extreme fear”; on a scale of 100 points, 0 represents traders’ maximum fear, and 100 represents maximum greed. For comparison, a week ago, before the mid-term elections, the index was at a neutral level.
In the total amount, Bitcoin accounts for $267.2 million, of which 88.9% comes from long positions; Ethereum recorded $167.14 million, with 81.1% also coming from long positions.
Forced liquidation occurs when a exchange automatically closes a position due to insufficient collateral, which can sometimes add additional selling pressure to a already declining market. Unlike regular trading, where investors can tolerate unrealized losses, leveraged trading provides a window of opportunity, but once the asset price breaks below a certain level, it can ultimately lead to the loss of all funds.
AI Stocks tumbled, but then managed to recover some of the lost ground
Panic is spreading on Wall Street following the mid-term elections, with U.S. tech stocks bearing the brunt on Thursday. The Nasdaq Composite Index fell by 5.52%, recording its worst single-day performance in 19 months; the Philadelphia Semiconductor Index tumbled by more than 12%, and NVIDIA alone lost over 9%.
The Democratic Party's victory in Tuesday's midterms has raised concerns in the market: stricter AI regulations may slow down the construction of data centers, which have been supporting this year's chip market. The S&P 500 index fell by 4.36% on Thursday, erasing about $3 trillion in market value of its constituent companies.
As reported by Decrypt on Thursday, as chip manufacturers experienced a decline, Bitcoin had already retraced some of the gains it made after the election. Forced liquidation of bullish crypto positions accelerated the downward trend. However, the simultaneous fluctuations in the stock market and tokens do not necessarily mean that it was solely stock market selling that caused Bitcoin's decline.
The stronger-than-expected U.S. employment report for October also raised market expectations for the Federal Reserve to raise interest rates again in December. Higher borrowing costs will suppress speculative markets, making crypto assets more vulnerable to pressure even as chip stocks rebound.
Bitcoin Price: What Does the Chart Show?
Currently, Bitcoin is trading at around $75,570, and the current candlestick pattern is still forming, with a intraday low of $74,780.91. The weekly chart shows another bearish candlestick. Since Bitcoin briefly broke above $87,000 in September, it has seen consecutive lower highs.
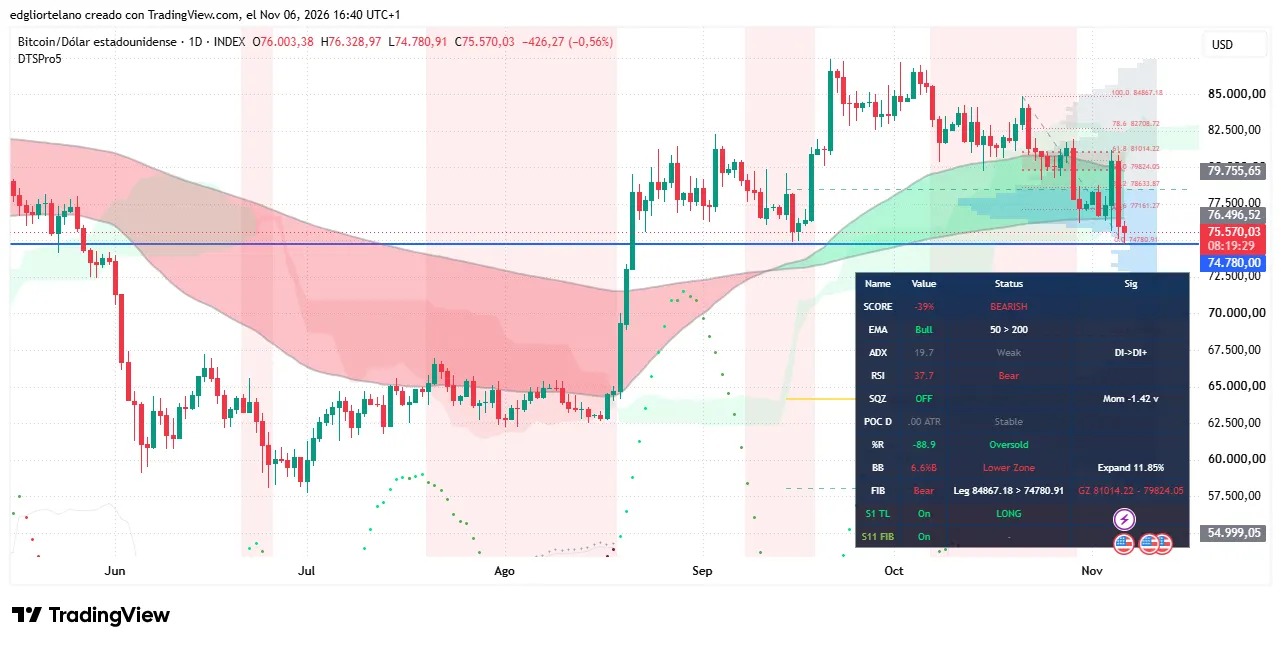
The 50-day exponential moving average ( EMA ) places more emphasis on recent prices, currently at around $79,756, which is higher than the 200-day EMA at about $76,497. In the longer term, this arrangement is still considered bullish, but since Bitcoin has now fallen below both moving averages, it indicates that the latest downward trend has overcome the lagging bullish signals.
The current direct support level is $74,780, which is also the horizontal line on the chart and the intraday low point. If the daily close falls below this level, market attention will shift to the $73,000 to $72,500 range, which is the area after the breakout in August; if this area is also lost, the next psychological barrier will be $70,000.
In the event of a rebound, Bitcoin will first face the 200-day EMA level of around $76,497, followed by a weaker immediate resistance near $80,000. The daily chart for Friday has not yet closed, and the low of $74,780.91 is a direct level that needs to be held at this time.
Disclaimer
The views and opinions expressed by the author are for informational purposes only and do not constitute financial, investment, or other advice.