

On September 28th, the price of Ethereum fell by 1.5% to around $2,665, due to rising oil prices following setbacks in negotiations between the United States and Iran. ETH is still above its daily moving average, but the 4-hour chart indicates that below $2,700, the trend strength is weaker.
Ethereum price fell after reaching a high of $2,703 during the session.
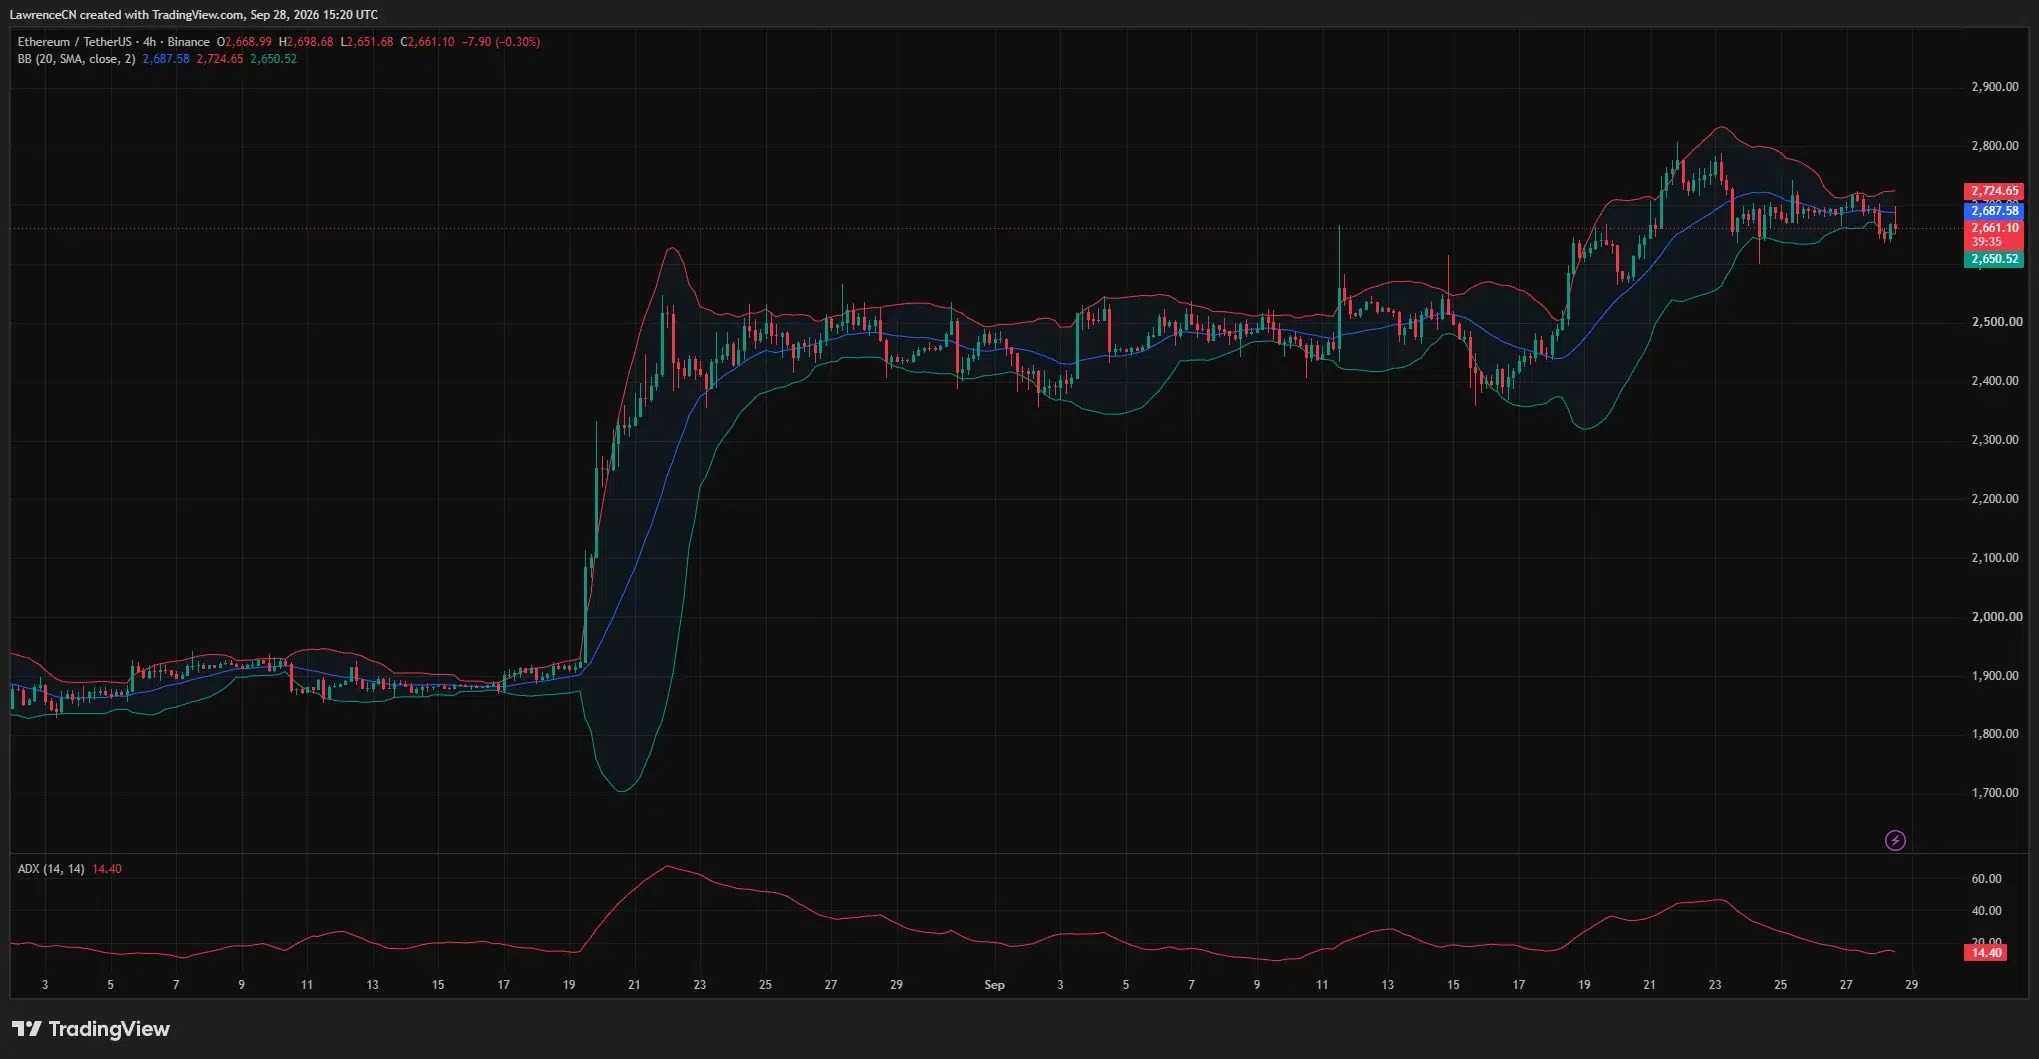
At 4 hours, the ADX is at 14.40, while the price is hovering near the lower band of the Bollinger Bands.
As shown by CoinGlass, there is a concentrated area of liquidations around $2700, as well as in the range of $2740 to $2750. Another such area is located near $2620.
Vitalik Buterin plans to describe Hegota in 2027 as possibly the last "normal" fork for Ethereum.
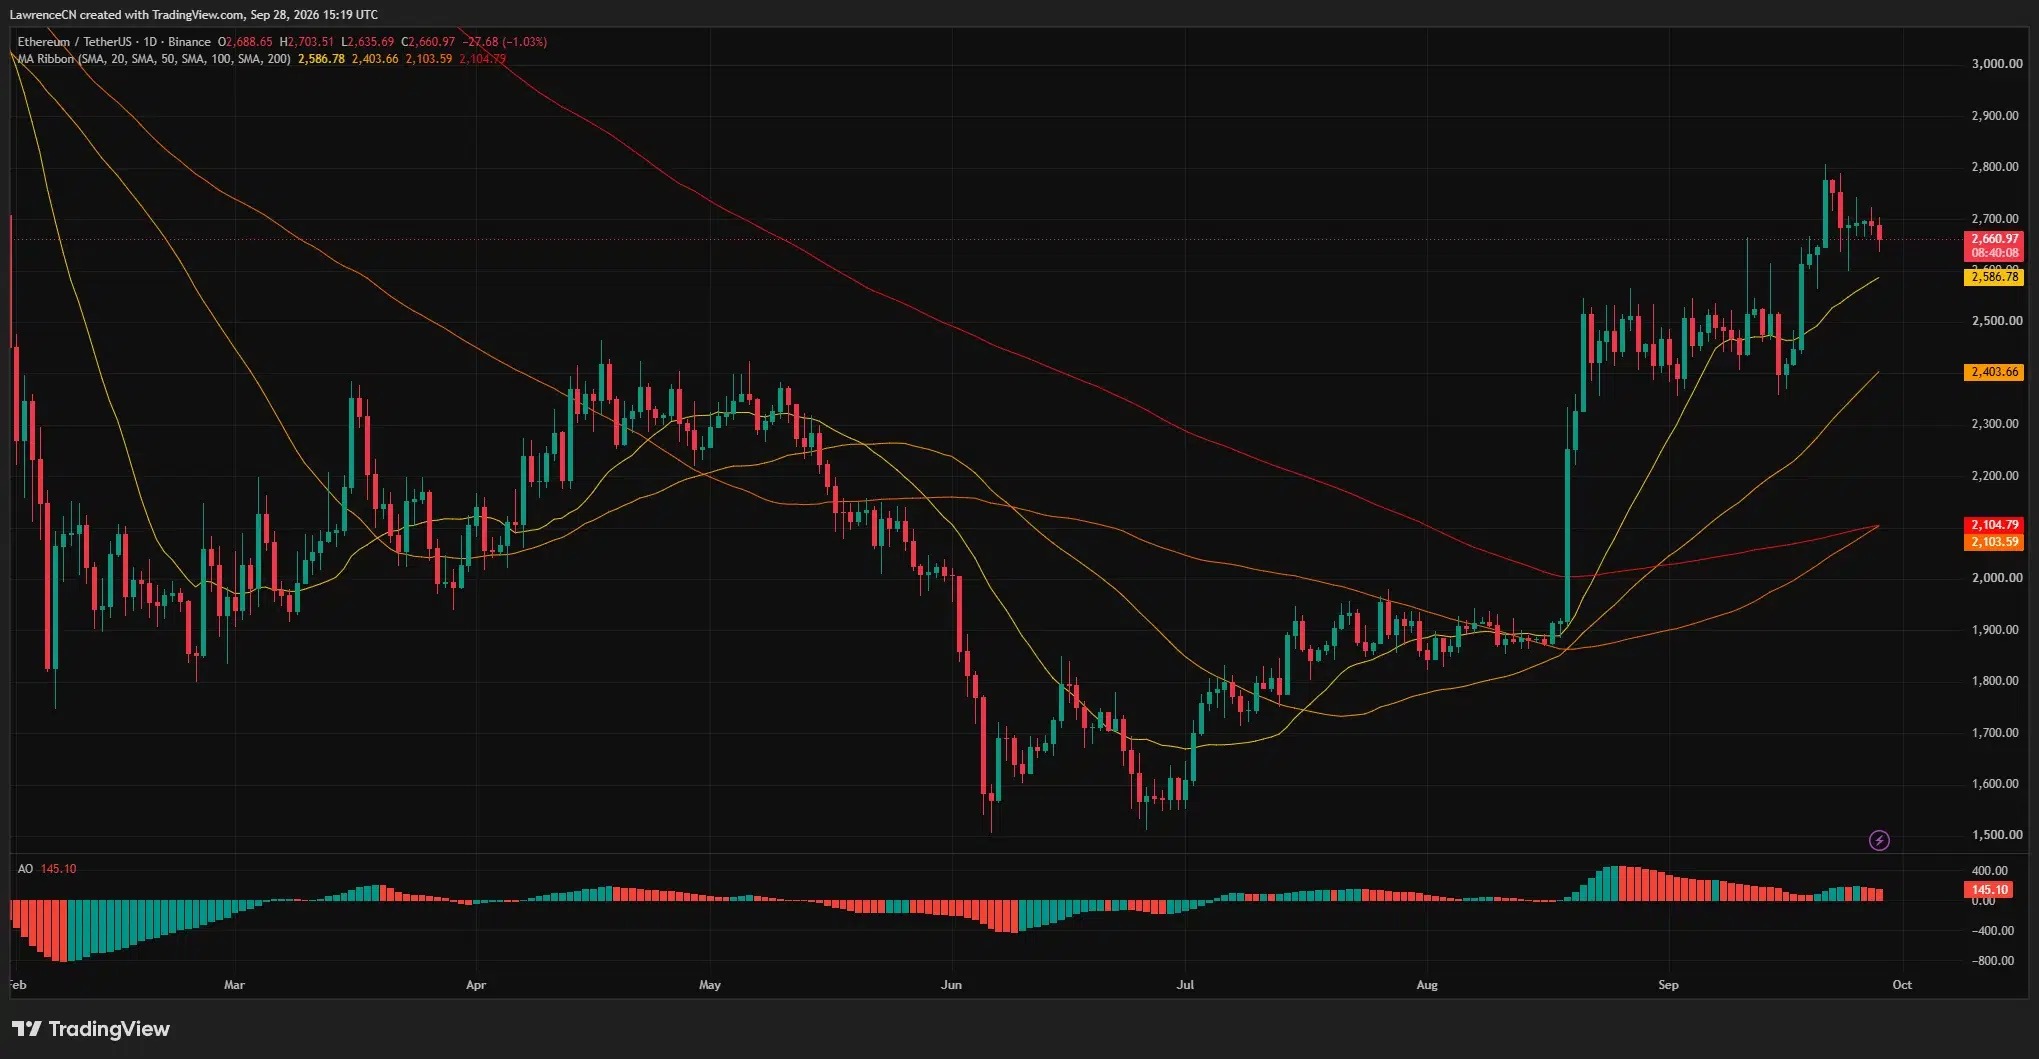
On the daily chart of Ethereum at Binance, ETH opened at $2,688.65, rose to a high of $2,703.51, and then fell to a low of $2,635.69. At the time the chart for TradingView was taken, trading prices were around $2,661. This trend makes $2,700 the latest level that buyers need to recapture, while the low point on Monday marked the first time it fell below $2,650.
Ethereum is still above the 20-day moving average.
Despite a decline on Monday, ETH remains above the four moving averages shown on the daily chart. The 20-day simple moving average is around $2,586.78, the 50-day moving average is $2,403.66, and the 100-day and 200-day moving averages are close to $2,103.59 and $2,104.79 respectively.
Therefore, when capturing the chart, the nearest moving average on the daily chart is located about $74 below the ETH price. Before sellers can reach this moving average, they must first fall below the low of $2,635 from Monday. If the price manages to rebound above the high of $2,703 of the same day, then the $2,800 range near the recent price zone will once again come into focus.
The 4-hour chart shows more direct pressure. The ETH trade is around $2,661, which is below the middle band of the Bollinger Bands at $2,687.58 and close to the lower band at $2,650.52. The upper band is located at $2,724.65.
Its 4-hour average trend index ( ADX ) has dropped to 14.40. This reading indicates that after ETH traded sideways below its recent high, the trend strength is weak. If it manages to re-cross above the middle band of the Bollinger Bands, $2700 and then the subsequent upper band at around $2725 will become key targets of attention. If it falls below the lower band, Monday's low of $2635 will become the next test level.
The clearing zone outlines a testing range of $2,700.
The three-day ETH settlement heat map for CoinGlass shows a band-like area around $2,700, with a brighter concentrated zone around $2,740 to $2,750. These levels are above the ETH price at the time the heat map was taken, and the higher range even exceeds the upper Bollinger Band on the 4-hour chart.
Below the market, a heat map indicates activity around $2,640 to $2,650, with another area of activity near $2,620. ETH once crossed part of the upper region during the decline on Monday, before rebounding. The marked clearing zones indicate prices at which leveraged positions may face forced liquidation; as traders adjust their positions, the scale and location of these zones may change.
Cryptocurrency analyst Ella indicates that she is focusing on the range of $2,715 to $2,720 as the first upward testing level for ETH after a rebound from around $2,667. She believes that if buyers can hold this range, the next horizontal level above would be $2,740. On the downside, she says that if $2,680 is lost, there could be another test of $2,665.
Analyst Gerla stated that the relative strength index of ETH has reached a lower high, while the price continues to maintain a broader breakout structure. Gerla considers the range between $2400 and $2450 as a wider support area and mentioned that if the price reclaims $2830, $3400 would become within sight. These levels describe structures on a longer time frame than the nearby 4-hour chart range.
Hegota The roadmap provides a longer-term perspective.
Ethereum co-founder Vitalik Buterin wrote on September 27th that the Hegota in 2027 could potentially be Ethereum's last "normal" fork. He stated that subsequent upgrades will involve recursive STARK, automated formal verification, more efficient consensus mechanisms, and progress towards quantum security.
Buterin also describes the long-term changes in Ethereum's design: as the network integrates its blockchain with more cryptographic verifications and decentralized systems outside of the main chain, the architecture will evolve. His post does not provide any short-term ETH price targets.
In terms of the current price structure, the key levels are closer to each other. ETH needs to first reclaim around $2688, which is near the middle band of the 4-hour Bollinger Bands, and hold above $2700 before it can test the upper band at around $2725, as well as the consolidation area between $2740 and $2750. If it falls below Monday's low of $2635, then the lower consolidation area around $2620 will come into view, followed by $2587, which is near the 20-day moving average on the daily chart.
DisclosureThis article does not constitute investment advice. The content and materials on this page are for educational purposes only.