


On October 7th, US spot Bitcoin ETF recorded a capital outflow of nearly $485 million, which is the largest single-day net outflow in over a year.
As Bitcoin fell to $82,000, this large-scale selling off occurred, erasing some of the gains brought about by " Uptober " at the beginning of the year. With the tensions around the Strait of Hormuz intensifying, risky assets are under pressure.
Bitcoin ETF saw a net outflow of $484.9 million
On October 7th, US spot Bitcoin ETF recorded a net outflow of $484.9 million, marking the largest single-day withdrawal since June 25th.
Just the day before, these BTC ETF still recorded a net inflow of 118.8 million US dollars.
Selling pressure also occurred in Ethereum ETF. On the same day, US spot Ethereum ETF recorded a net outflow of $160.9 million, indicating broader selling pressure in crypto investment products.
Bitcoin falls amid the Hormuz crisis, oil prices rise to $104
On the occasion of the outflow of funds from ETF, Bitcoin fell below $83,000, recording its lowest daily closing price in 17 days.
As geopolitical tensions escalate, selling pressure has further increased. Coinpedia News reports that Iran has intensified missile and drone attacks on commercial oil tankers near the Strait of Hormuz.
Tensions drove Brent crude oil futures above $104 per barrel in December, sparking new concerns about rising inflation in the market.
Bitcoin targets the $81,000 support level; a bearish pattern has formed.
From the daily chart perspective, Bitcoin is trading around $83,025 and has formed a bearish “M” pattern, with prices moving towards the neckline of that pattern.
The key level to watch is $81,108. However, if the daily close falls below this support level, it could confirm this bearish pattern and cause Bitcoin to drop to the next major support level of $76,141.
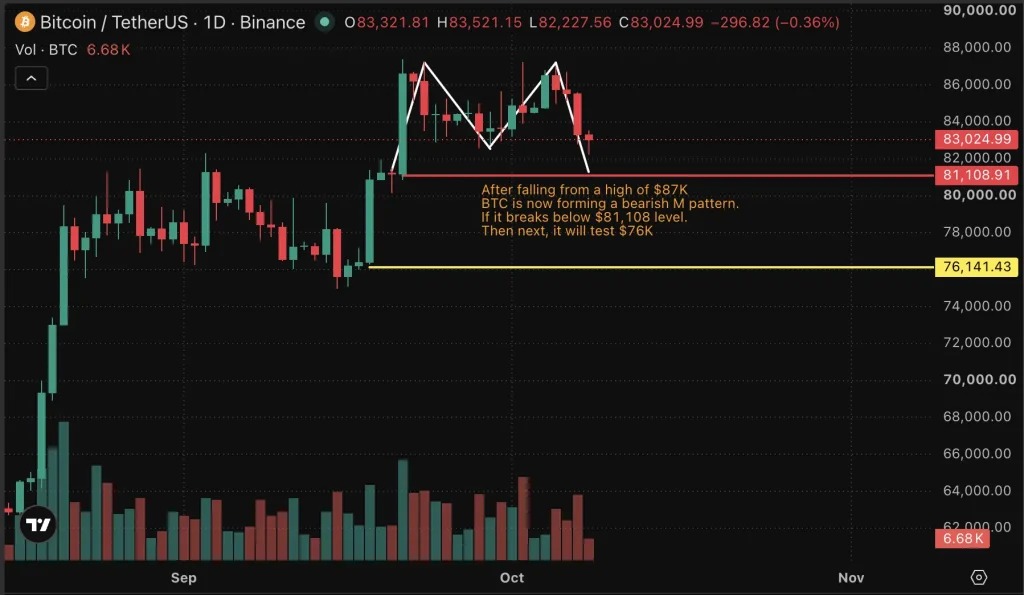
Current market data shows that BTC is testing in the range of $82,000 to $83,000, which makes it an important demand zone.
On the other hand, if buyers hold the $81,108 support level, Bitcoin could regain its strength. The weekly chart is also forming a cup and handle pattern, which could provide support for a rebound.
If the price breaks through $87,000, it will weaken the bearish M-pattern and may open up space towards the January high of $97,952.