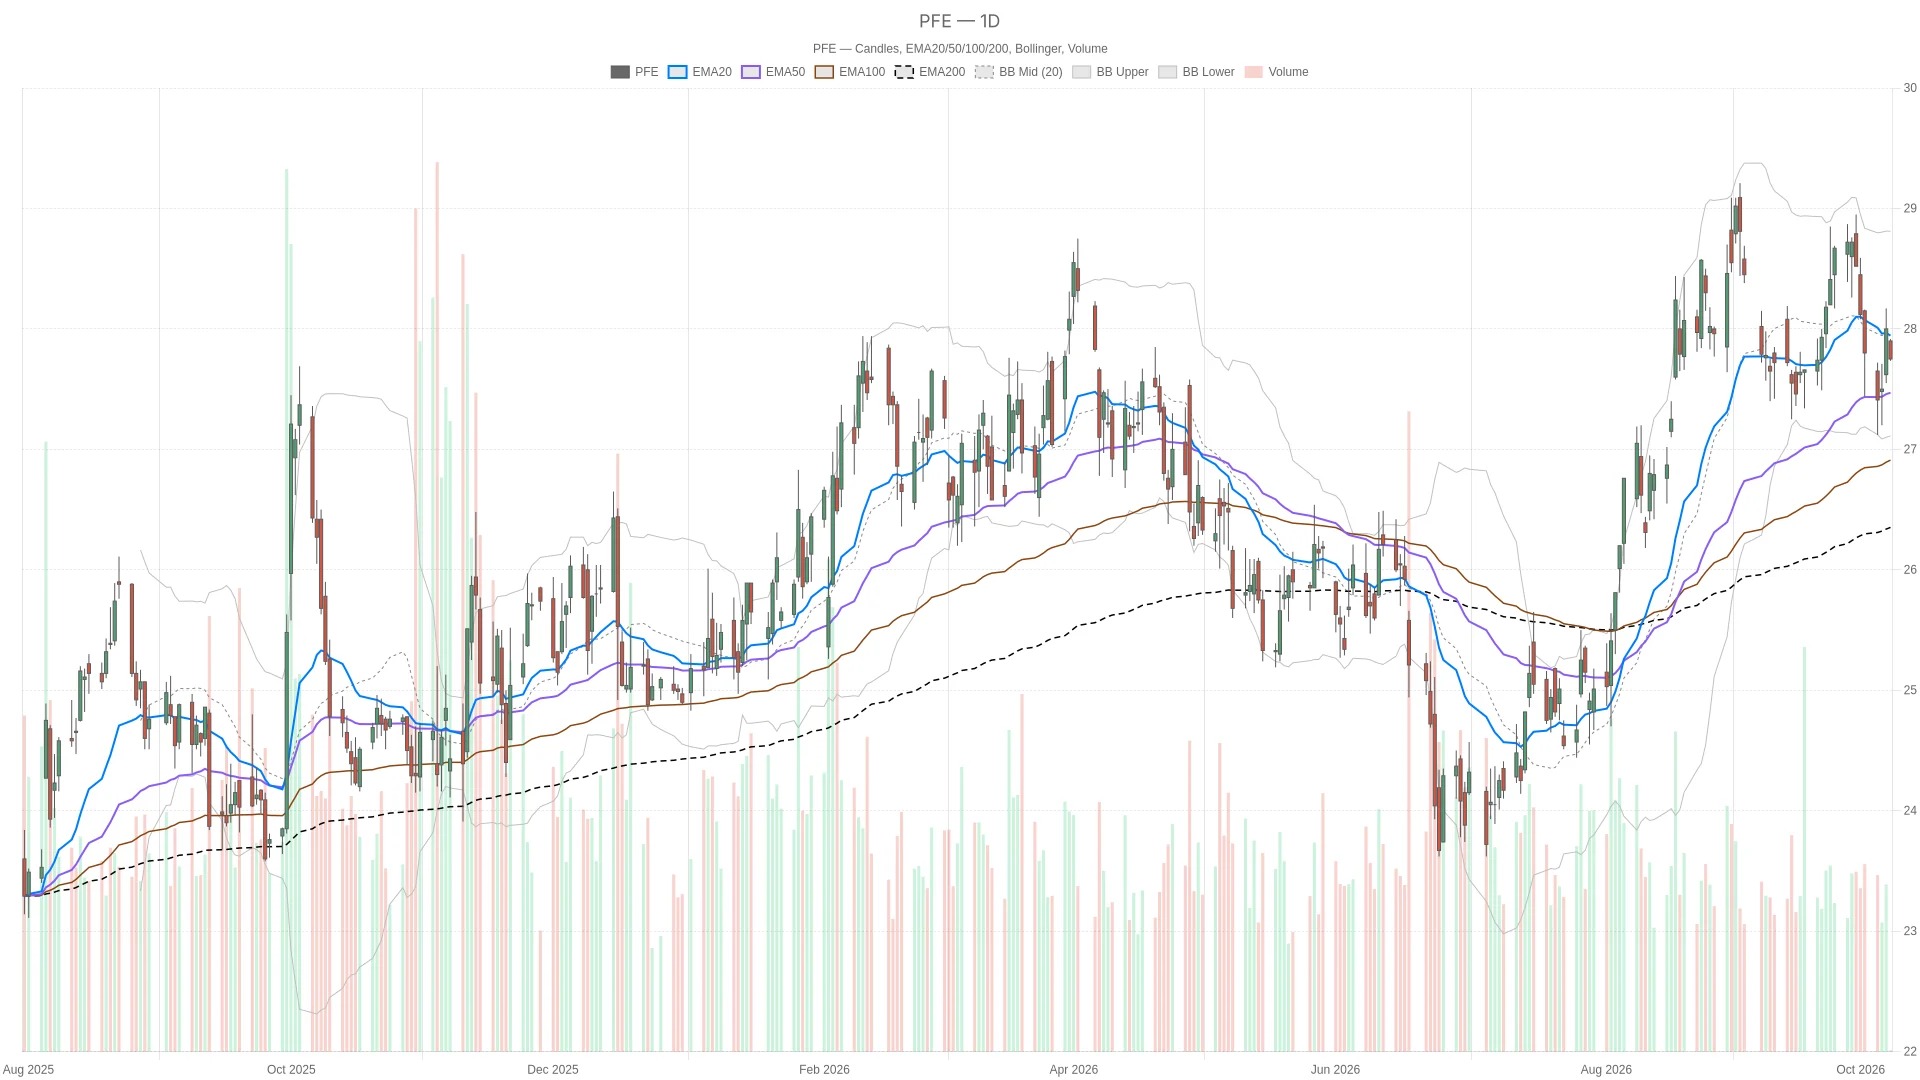
As of 10:06 a.m. Eastern Time on Thursday, Pfizer's stock price was at $27.75, down 0.89% from the previous trading day's close. Pfizer's stock opened at $27.90 and fluctuated between $27.73 and $27.91 during the session, with the latest price at $27.75; the previous closing price was $28.00. The daily trend remains neutral, with the price below the 20-day moving average but above the 50-day and 200-day moving averages. The current trading session is still in progress.
Key Points
- As of 10:06 a.m. Eastern Time on Thursday, October 8, 2026, Pfizer's stock price was at $27.75, down 0.89% from the previous closing price.
- The daily line RSI14 is at 48.16, which is below the neutral threshold of 50; the daily line MACD bar chart shows -0.11.
- The daily pivot point is at $27.91, with resistance above that level; S1 is at $27.64, providing support below; R1 is at $28.26.
- The hourly line RSI14 is at 47.88, which is below 50; the hourly line MACD in bar chart format is at 0.06, which is a positive value.
- On the 20th, EMA was at $27.94, on the 50th it was at $27.47, and on the 200th it was at $26.46.
Pfizer stock: The daily support level is still below the upper resistance.
On the daily chart, the 20-day EMA is at $27.94, which is higher than the current price. Meanwhile, the 50-day EMA is at $27.47, and the 200-day EMA is at $26.46, both of which are lower than the current price. This arrangement makes the daily chart pattern appear mixed, rather than being consistent in any one direction.
In addition, the price is below the middle band of the daily Bollinger Bands at $27.96, and still remains between the lower band of $27.11 and the upper band of $28.81. The daily ATR14 indicator is at $0.52, providing a reference for volatility during this trading period.
The daily pivot point of $27.91 is above, while the first support level S1 is at $27.64, which is still below the current price. The first resistance level R1 is at $28.26. These levels are derived from the previous completed daily candlestick chart and are applicable to the current trading session.
Pfizer stock hourly chart: Divergent signals

On the hourly chart, the price is below the 20-hour EMA of $27.8, as well as the 50-hour EMA of $27.9 and the 200-hour EMA of $27.92. The moving averages are bearish in alignment. The hourly RSI14 is at 47.88, which is also below the 50-hour average, confirming the cautious momentum readings shown on the daily chart.
However, the hourly MACD line is at 0.03, which is higher than the signal line of -0.03, forming a positive bar chart of 0.06. The price is also still above the middle band of the hourly Bollinger Bands at $27.66. These readings make the slightly bearish moving average structure more complex, but they do not overturn the neutral bias on the daily chart. The hourly ATR14 is at $0.19.
The hourly pivot point is above $28, with the first hourly support level S1 at $27.94 and the first resistance level R1 at $28.04. Although nominally a support level, S1 is currently above the current price, indicating a level that needs to be regained.
From a short-term perspective, the 15-minute chart is even less favorable. The price is below both the lower band of the Bollinger Bands at $27.81 and the pivot point at $27.85. The RSI14 indicator is at 38.74, which is below 50 but has not yet entered an oversold area. The MACD line is 0.01 below the signal line at 0.07, forming a negative bar chart of -0.06. Meanwhile, on the 15-minute chart, the ATR14 indicator is at $0.1, which is higher than $0.09 of the previous candlestick. This time frame is more used for reference purposes rather than as a primary basis for making decisions.
The news provides different perspectives.
Meanwhile, a report published by Motley Fool before the opening on Thursday described Pfizer as having a price-earnings ratio of less than 10 times based on expected earnings, with a dividend yield of nearly 6%. Another report by Motley Fool released on Wednesday warned that Pfizer might face a particularly difficult period. A report also published on Wednesday by Yahoo Finance linked the lower profit multiple to a contraction in profit expectations. These are judgments from relevant media and do not necessarily prove to be the reasons for the price changes during this trading period.
Meanwhile, on Wednesday, Yahoo Finance reported that LITFULO showed positive results in terms of clinical efficacy and safety in stage three of non-segmental vitiligo treatment. Investing.com also reported on Wednesday that Pfizer would cut 330 jobs at its Sicilian factory. These reports provide different clinical and operational contexts.
Bullish and bearish conditions for Pfizer stocks
For a bullish scenario to materialize, Pfizer's stock needs to hold above the daily level of $27.64 ($BJWKEEP_00001__), and regain the daily pivot point of $27.91. If it can further surpass the 20-day moving average of $27.94 ($BJWKEEP_00002__) and the middle band of the Bollinger Bands at $27.96, the bullish outlook will be even stronger. At that time, the daily level of $28.26 ($BJWKEEP_00003__) will become the next resistance level, followed by the upper band of the Bollinger Bands at $28.81.
On the contrary, if it falls below the daily support level of $27.64 ($BJWKEEP_00001__), it will weaken the aforementioned bullish outlook. The next lower reference levels are the 50-day moving average of $27.47 ($BJWKEEP_00002__) and the lower band of the daily Bollinger Bands at $27.11. The fact that the hourly candlestick chart has turned positive ($BJWKEEP_00003__) alone is not enough to offset the impact of losing these daily support levels.
Overall, Pfizer is currently situated between the daily support level of $27.64 and the pivot point of $27.91, with a ATR14 of $0.52. The daily trend remains neutral, while intraday signals are divergent. Whether the price can regain the upper daily resistance levels remains to be further verified during open trading hours.
Frequently Asked Questions
What is the technical outlook for Pfizer's stock?
The daily trend of Pfizer's stock is neutral. The price is below the 20-day EMA of $27.94, but above the 50-day EMA of $27.47 and the 200-day EMA of $26.46. The daily RSI14 is 48.16, which is below the neutral threshold of 50, and the MACD bar chart shows -0.11.
What are the key price levels for Pfizer shares?
The daily support level S1 is at $27.64, and the daily pivot point is at $27.91; there is pressure above this level. The daily resistance level R1 is at $28.26. The 20-day moving average EMA at $27.94, as well as the middle band of the Bollinger Bands at $27.96, are also upper levels that need to be reclaimed.
What does the hourly line signal display?
The value at hour RSI14 is 47.88, which is below the neutral value of 50. However, the value at hour MACD in the bar chart is 0.06, indicating a positive value. The price is lower than that at hour EMA, but higher than the middle band of the hourly Bollinger Bands, which is 27.66 dollars. Therefore, the readings during the session show a mixed pattern.
Cryptonomist and the author do not hold any positions in the financial instruments mentioned in this text, nor have they received any compensation from the companies reported.
This article was generated with the assistance of artificial intelligence and has been reviewed by an editorial team.