











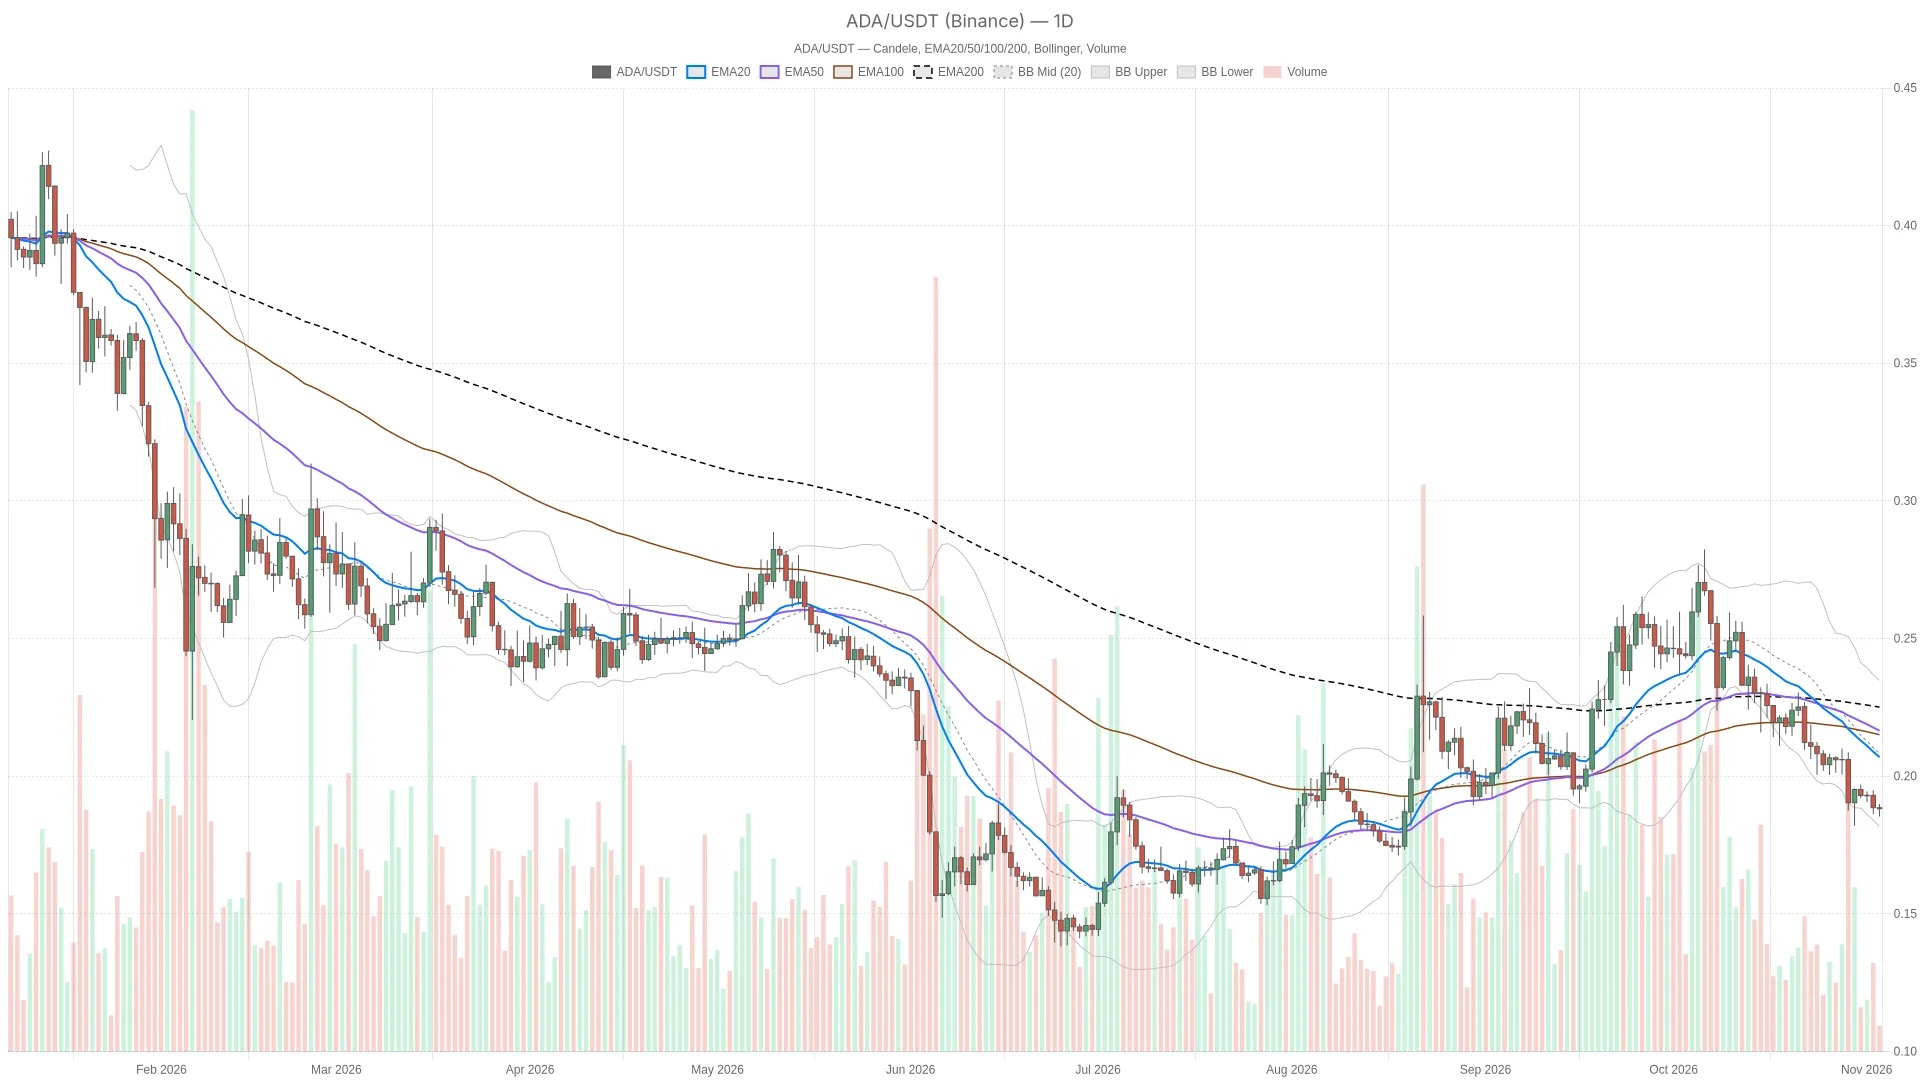
As of November 3, 2026, the price of Cardano was reported at $0.1882 on Binance. The downward trend over the longer term still outweighs any short-term improvements. The main outlook remains bearish: the price is below the three-day moving averages, and the rebound in the smaller time frames has not yet corrected the broader structural issues.
Key Points
- ADA is trading at $0.1882 in Binance, below the three-day moving average of EMA. The moving averages are bearish in alignment.
- The daily line RSI is at 30.6, close to the oversold range, while the MACD bar chart is converging towards the zero axis.
- If the daily chart closes above the pivot point of $0.1899, it will trigger a rebound; if the hourly chart closes below $0.1876, it indicates a continuation of the downward trend.
- Cardano DEX The trading volume shows weekly variation, with no clear overall-chain trend.
The current direct confrontation is a struggle between a mean-reversion rebound and a renewed weakening trend. The daily MACD bar chart indicates that the selling pressure is weakening, but the daily RSI chart still shows a downward trend. This divergence is significant: a slowdown in the downward momentum does not necessarily mean that a lasting reversal has already occurred.
Fearful emotions, combined with weak DEX activity, constitute a defensive background.
Cardano DEX Data shows that in the past 24 hours, the total trading volume on the Cardano blockchain through decentralized exchanges was 840,276.00 US dollars. This represents the overall transaction activity on the chain, not the trading volume, fees, or revenue of ADA itself. At the same time, the daily trading volume changes for the listed exchanges were generally negative, with Minswap DEX showing a decrease of -27.50% and Dano Finance showing a decrease of -30.50%. There are almost no signs indicating an increase in participation.
The weekly situation shows a more differentiated trend: Minswap DEX saw a 104.12% increase in trading volume, Dano Finance experienced a 66.51% decrease, and WingRiders saw a 3.39% decline. This differentiation does not support the notion that the growth of one platform can be considered as a recovery for the entire chain.
Despite a rebound during the session, the price structure of Cardano remains bearish.
Line data shows that ADA is below the daily average of EMA20 at $0.2089, EMA50 at $0.2177, and EMA200 at $0.2255, and these three moving averages are arranged in a bearish pattern. The distance between the price and this set of averages indicates that there is still room for a rebound without changing the overall bearish trend of the daily chart.
The hourly chart further reinforces this cautious attitude. The current quote is $0.1881, which is lower than the $0.1886 of EMA20, $0.1903 of EMA50, and $0.1972 of EMA200. Additionally, the moving averages are also arranged in a bearish manner. The most recent hourly K-line closed at $0.1880; the current slight improvement is not yet sufficient to constitute a structural breakthrough.
Only the execution cycle shows some recovery. On the 15-minute chart, the price is above $0.1875, which is EMA20, and $0.1881, which is EMA50, but still below $0.1902, which is EMA200. The arrangement of the moving averages remains bearish. In fact, the short-term momentum is improving within a larger downward trend, rather than replacing it.
As it approaches the lower track of the daily line, the improvement in momentum is not even.
On the daily chart, RSI is at 30.6 and continues to move downward, approaching the oversold zone but has not yet fallen below 30. Meanwhile, the bar chart for MACD on the daily chart still shows negative values, but it is converging towards zero. These signals are contradictory to each other: from one indicator, the downward momentum is easing; from the perspective of relative strength, the market is still weak.
The hourly readings are more positive, but it's still not enough to consider a clear bullish trend. RSI has risen to 44.6, and the negative MACD bar chart continues to converge towards the zero axis. On the 15-minute chart, RSI has risen to 53.6, and the positive bar chart continues to expand. This supports the current rebound, but the hourly RSI is still below 50, indicating that from a multi-period perspective, this round of recovery is not yet convincing enough.
The lower band of the daily Bollinger Bands is at $0.1840, which is below the current price. The middle and upper bands of the daily Bollinger Bands are $0.2104 and $0.2368, respectively. The price is closer to the lower band than to the middle band; this stretched position can accommodate mean reversion, but it is not in itself a reversal signal.
The daily line ATR is at $0.01183, the hourly line ATR is at $0.001580, and the 15-minute line ATR is at $0.0007176. The range of fluctuations on the daily line is quite significant compared to the nearby pivot points. Therefore, a brief intraday breakthrough is not as convincing as a confirmation at the close of trading.
The daily pivot point will distinguish between a rebound attempt and continued pressure.
The rebound of ADA first has to face the daily pivot point of $0.1899, followed by the daily R1 of $0.1936. On the lower side, the hourly pivot point of $0.1876 is the nearest support level, followed by the hourly S1 of $0.1870. The daily S1 of $0.1849 is an even more crucial reference level for the downward trend.
Bullish scenario: If the daily close is above the daily pivot point of $0.1899, it will trigger a rebound towards the daily R1 of $0.1936. However, this would still be a counter-trend rebound and would not confirm that the bearish structure on the daily chart has ended. If the subsequent daily close is below the daily S1 of $0.1849, then that rebound scenario will not materialize.
Bearish scenario: If the hourly chart closes below the hourly pivot point of $0.1876, it will trigger a continuation of the downward trend, with the target being the hourly S1 of $0.1870, followed by the lower band of the hourly Bollinger Bands at $0.1865. A further extension would bring the daily S1 of $0.1849 into view. If the hourly chart closes back above the middle band of the hourly Bollinger Bands at $0.1885, then this immediate breakout scenario will become invalid.
The most likely false signal is when there is an upward breakout during the session, but it fails to continue and re-establish a position at the key level on the daily chart. The positive momentum at the 15-minute level makes this trend feasible, yet the bearish EMA structure on the daily and hourly charts makes it prone to a pullback. The daily ATR also reinforces this uncertainty: touching a certain price level on the unclosed K-line does not equate to a confirmed breakout.
Frequently Asked Questions
Is $0.1882 the completed daily closing price?
No. This is the real-time quote for Binance corresponding to the still-forming daily K-line. The previously completed daily K-line closed at $0.1886.
DEX Does the data only count the transactions of ADA?
No. The data covered by DEX is the trading volume of decentralized exchanges on the Cardano blockchain, which is not limited to ADA. It also does not represent transaction fees or revenues.
This article was generated with the assistance of artificial intelligence and has been reviewed by an editorial team.
Lorenzo Marcek is a financial journalist and senior crypto market analyst, known for his clear, data-driven reporting style on digital assets. With a background in economics, he has been covering global markets for over a decade, focusing on on-chain indicators, institutional adoption trends, and macroeconomic factors that drive crypto market fluctuations. His work combines investigative journalism with technical market insights, making him a trusted source for traders seeking solid and actionable analysis.