












Bitcoin has fallen back to $75,000, with ETFs withdrawing $840 million in two days. Where will BTC ultimately head? On November 9, a reversal in macro interest rate expectations and structural rotation of institutional capital led to a fierce tug-of-war around the $75,000 threshold. Is this a struggle before a breakdown, or a deep squat to wash out positions and accumulate strength? This article combines the latest technical charts from CoinMeta, on-chain data, and leveraged liquidation structure to deeply analyze the bull-bear battle logic behind the $75,000 dividing line and find the definitive answer for the next move.
Table: Overview of Latest Bitcoin Data
| Data Item | Latest Reading |
|---|---|
| BTC Spot Price | 73,743 USDT (intraday low) |
| 24-Hour Spot Trading Volume | Approx. $8.923 Billion, +41.30% QoQ |
| Network-Wide Contract Open Interest | $51.525 Billion, +117.21% in 24 hours |
| BTC Funding Rate | +0.00125% / 8 hours |
| 24-Hour Network-Wide Liquidations | $54.47 Million |
| Binance BTC Long/Short Account Ratio | 2.16 |
| US Spot BTC ETF Cumulative Net Flows in 2026 | Net outflow of approx. $502 Million |
| Most Recent Single-Week ETF Net Outflow | $1.28 Billion |
| Total BTC Wallet Balance on Exchanges | 2.5811 Million BTC |
| Crypto Fear & Greed Index | 28/100 |
Note: The above content is compiled and summarized by CoinMeta based on public market data. Please refer to actual data if there are any fluctuations.
Bitcoin Latest Price Analysis
According to CoinMeta's latest Bitcoin daily chart and derivatives market data, we can analyze that Bitcoin is currently in a bottoming phase where "technical downside momentum is exhausted, but structural risks have not yet cleared." The $75,000 level is not only a key support on the chart but also the dividing line that tests the nature of this correction.
Technicals: Downside Momentum Exhausted, But Rebound Not Yet Confirmed
The core signal from the candlestick chart below is that "Bitcoin is in a sideways repair after a sharp drop," not a trend reversal.
MACD Histogram: Has shifted from dark green to light green and continues to narrow; the fast and slow lines are flattening below the zero axis, and bearish momentum has clearly weakened;
RSI: Reading 55.50 is in the neutral zone, neither oversold nor overbought, which we view as a market stalemate.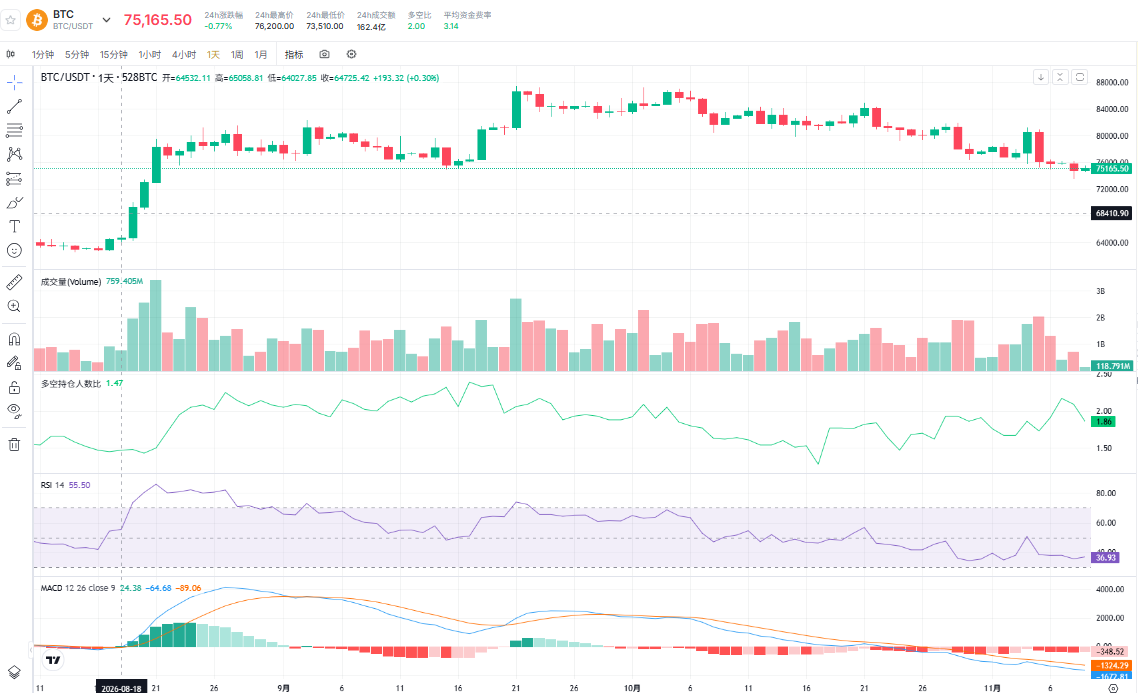
Image: Bitcoin Daily Chart Analysis
Additionally, around $75,000, the price repeatedly printed doji and small-body candles with shrinking volume, which is typically a pattern indicating that selling pressure has temporarily been released but buying demand is equally scarce.
The current price is below the Bollinger Band middle line, with the upper band at about $79,900 forming short-term resistance, and both the 50-EMA and 200-EMA pressing down from above. Our view is that $74,819 is the "lifeline" for this repair rally; as long as it is not broken on heavy volume with a real body, the bottoming logic remains valid. Conversely, if it is lost on heavy volume, the next reference level points directly to around $73,000.
Leverage Structure: Blood Has Been Drained, But Longs Remain Crowded
We need to combine the macro backdrop of "Bitcoin falling back to $75,000 and ETFs withdrawing" with a deep microstructure breakdown.
The 24-hour period showed overwhelming "long squeeze": total network liquidations reached $534 million. Among them, long liquidations reached $480 million, accounting for nearly 90%, while short liquidations were only $54.07 million. Bitcoin's decline caused a brutal long stampede. Whales were precisely targeted: the top two single liquidations both occurred on Bitfinex, valued at $178 million and $174 million respectively, and both were longs; the third was a $36.44 million long on Binance.
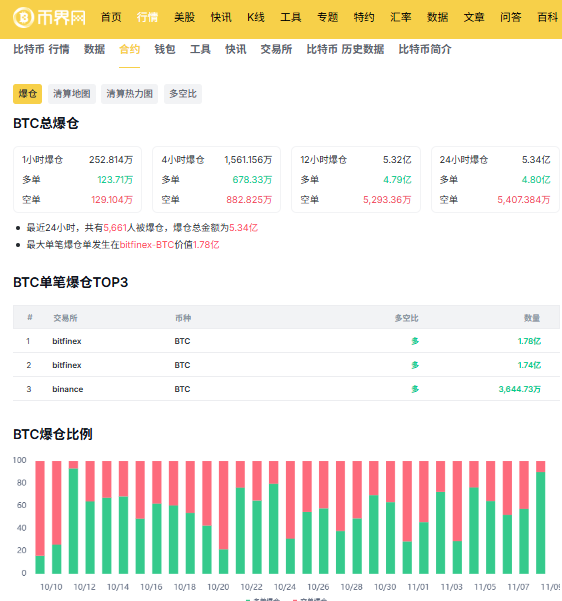
Image: Bitcoin Derivatives Analysis
Nearly $400 million in single massive long positions were liquidated. A bloodbath of this magnitude often means the short-term bottom is forming faster, because the most stubborn whale leverage has been cleared out.
We speculate that if the next rebound lacks spot buying and ETF inflows, once the price breaks below the previous low (around $74,819) again, those who just shorted will profit handsomely and trigger a new round of panic selling.
Capital and Macro: ETF Outflows Are a Suppression, But Not the Only Narrative
Against the backdrop of Bitcoin falling back to $75,000, what does $840 million in ETF outflows over two days mean?
The market is accustomed to treating total ETF outflows as a signal of "institutions collectively fleeing." Is that really the case?On November 6, BlackRock's IBIT saw a single-day outflow of $403 million, the largest single source of redemption that week; on the same day, Fidelity's FBTC recorded a net inflow of $42.8 million. Of the five trading days that week, only November 5 achieved a net inflow of $74.6 million, with the other four days all negative. Outflows on Monday, Thursday, and Friday reached $398.6 million, $430.2 million, and $411.9 million respectively. In our view, this $840 million is not all managers reducing positions in the same direction simultaneously, but a structural rotation where a few top products concentrated redemptions while some products bought against the trend.
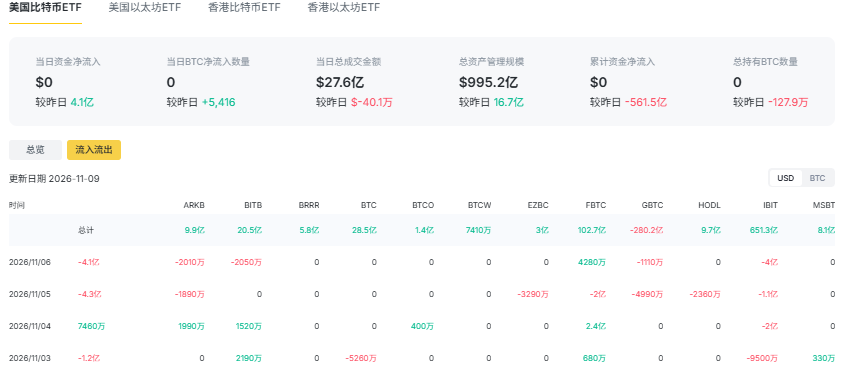
Image: Bitcoin ETF Overview
What triggered this rotation?
The answer is: macro variables.October nonfarm payrolls added 165,000 jobs, far exceeding the market consensus of about 65,000, and the unemployment rate fell to 4.1%, directly reversing the rate-cut expectations that had briefly warmed due to the tech stock sell-off; CME FedWatch showed the probability of a December rate hike jumping from 66.9% to 76.8%. Strengthening rate hike expectations means the opportunity cost of holding zero-yield assets rises, and Bitcoin ETFs happen to be the "macro expression tool" that has been easiest to enter and exit over the past year.From this perspective, the essence of the $840 million outflow is that Bitcoin ETFs have shifted from a bull-market positive to a "marginal seller" during a correction, rather than a new crack appearing in Bitcoin's fundamentals.
BTC Future Scenarios: Three Conditions Determine Whether $75,000 Holds
Bitcoin has fallen back to $75,000, and ETFs have withdrawn $840 million in two days. What's next for BTC? In our view, it depends on weekly verification of the following three observation anchors, not single-day candlesticks:
The Gain or Loss of the $74,819 Weekly Close
If the weekly candle can close above this level, the bottoming structure is maintained, and the repair target points to $77,000-$77,500 (near the 50-EMA); if the weekly candle closes below it with a real body, the $73,000 issue will be officially activated, and we need to observe whether there is volume absorption at that level.
Whether the Liquidation Structure Shifts from "Long-Dominated" to "Two-Way Balanced"
Currently, longs still account for 77% of liquidations. If, during the stabilization process around $75,000, the liquidation composition gradually shifts to a rising share of shorts, it indicates shorts are starting to be squeezed out and the bottom structure is healthier. Conversely, if the long/short ratio continues to climb during the rebound, it means crowding has not eased and downside risk continues to accumulate.
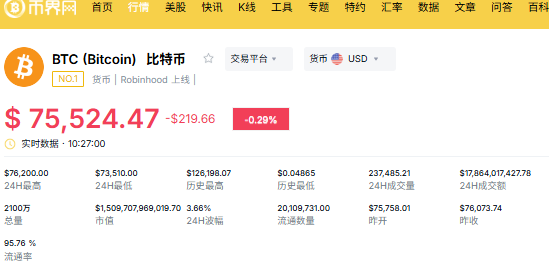
Image: Bitcoin Latest Price
Whether ETF Outflows Show a Trend of Narrowing
In our view, the $1.28 billion weekly outflow from Bitcoin ETFs does not itself constitute a trend judgment. The key is whether next week narrows to the hundreds of millions level, and whether products other than BlackRock's IBIT can provide hedging inflows.
Before the December FOMC meeting (December 8-9), macro rate expectations will likely remain hawkish, and a systemic reversal in ETF capital flows will be difficult. But this does not mean BTC will decline linearly. The essence of bottoming is using time to exchange for chips transferring from weak hands to strong hands, and $75,000 is precisely the pricing center of this transfer.
In one sentence: Technicals have given preliminary evidence of "stopping the decline," but liquidation structure and ETF flows have not yet given confirmation signals of a "reversal." Above $75,000 is repair; below $75,000 is a second pricing of risk.
Conclusion
Bitcoin falling back to $75,000 and ETFs withdrawing $840 million in two days, in our view, is essentially capital rotation and leverage washout under a shift in macro policy. Although technicals currently show signs of stopping the decline, leveraged longs remain crowded, and $75,000 ($74,819) has become the key dividing line determining BTC's next move. Holding it maintains bottoming and accumulation; breaking below it faces a risk test at $73,000. Investors are advised to closely watch signals of narrowing ETF outflows and the weekly closing price, and respond rationally.
FAQ
Will Bitcoin break below $75,000?
Answer: Not necessarily. The key is the $74,819 weekly support. If this level is broken with a real body, it may trigger cascading liquidations of longs holding on, with the next target pointing to $73,000. If it stabilizes, the bottoming repair posture is maintained.

Do ETF outflows mean the bull market is over?
Answer: Not necessarily. The $840 million ETF outflow over two days is structural capital rotation and macro interest rate suppression. Although it causes short-term pain, historical cumulative net inflows exceed $55 billion. This is currently profit-taking and leverage washout, not an absolute end to the trend.
Disclaimer: Readers are strictly advised to comply with local laws and regulations. This article is compiled based on public market data for reference and educational purposes only, and does not constitute investment advice. Follow CoinMeta for the latest updates.