





Nvidia has claimed the S&P 500's top weighting spot, pushing Apple to second place. But do you really understand who calls the shots in this benchmark of US equities? As the AI boom propels the chip giant onto the "Iron Throne," the power dynamics of the S&P 500 have quietly been rewritten.
As of September 2026, the S&P 500 top 5 companies are:
Nvidia (7.68%)
Apple (6.96%)
Microsoft (5.58%)
Amazon (3.85%)
Alphabet (3.03%)
These five names alone account for nearly 30% of the entire index weighting. CoinMeta breaks down the latest weighting data and the September rebalancing list to help you decode the industrial shifts behind the index.
What Is the S&P 500?
The S&P 500 Index is the premier US large-cap equity benchmark, compiled and maintained by S&P Dow Jones Indices and officially launched on March 4, 1957. It tracks approximately 500 leading companies listed on major US exchanges, using a float-adjusted market-capitalization weighting methodology,meaning larger companies exert greater influence on the index's movements.
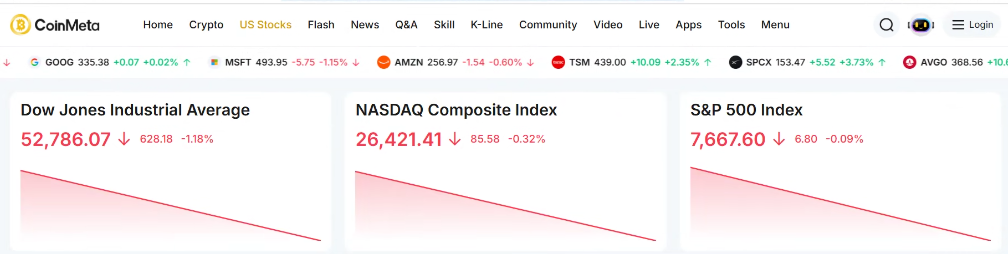
Coinmeta US Stocks Section – S&P 500 Index
As of July 31, 2026:
Total market cap of S&P 500 constituents: approximately $74.87 trillion
Covers roughly 80% of the total US stock market value
Average constituent market cap: approximately $108.4 billion
Median constituent market cap: approximately $38.2 billion
Information Technology is the largest sector (weighting ~34.48%)
The top three sectors—Information Technology, Communication Services, and Financials—together account for 61.68% of the index
The top 10 constituents together represent 41.37% of the total index weighting
S&P 500 Top 5 Companies
The S&P 500 uses float-adjusted market-cap weighting,the larger the weighting, the greater the impact on index movements. As of end of August 2026, the S&P 500 top 5 companies are:
| Rank | Company | Ticker | Weighting |
|---|---|---|---|
| 1 | Nvidia | NVDA | 7.68% |
| 2 | Apple | AAPL | 6.96% |
| 3 | Microsoft | MSFT | 5.58% |
| 4 | Amazon | AMZN | 3.85% |
| 5 | Alphabet | GOOGL | 3.03% |
Source: CoinMeta, as of August 27, 2026
Analysis: Nvidia, fueled by explosive growth in AI computing chips, has surpassed Apple to become the S&P 500's largest weighting. Thetop three aloneNvidia, Apple, and Microsoft,combine for 20.22% of the index, exceeding the entire weighting of the Energy or Utilities sectors.
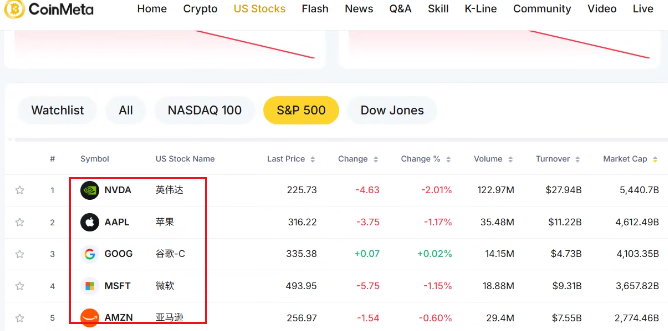
S&P 500 TOP5
Our take: Five years ago, the S&P 500 was a two-horse race between Apple and Microsoft. Today, Nvidia's rise to the top signals that AI computing power has replaced consumer electronics as the market's core pricing logic. Changes in index weightings are, at their core, a voting machine for industrial transformation.
S&P 500 Rebalancing: Who's In, Who's Out?
CoinMeta reports that S&P 500 constituents are not fixed,the index undergoes quarterly reviews and adjustments. On September 5, 2026, S&P Dow Jones Indices announced the latest rebalancing, effective at market open on September 21, 2026.
Three Additions:
Bloom Energy (BE)
A solid-oxide fuel cell manufacturer benefiting from AI data center power demand. In Q2 2026, the company reported revenue of $1.065 billion, up 165.5% year-over-year,its first quarter exceeding $1 billion.
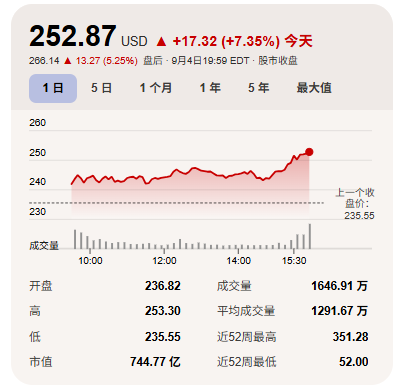
Bloom Energy (BE) – Latest Stock Price
Product revenue reached $935 million, up 215% year-over-year. As of September 4, 2026, BE closed at $252.87, up 191% year-to-date, with a market cap of approximately $74.48 billion and a P/E ratio of approximately 332.72x.
Illumina (ILMN)
A global leader in gene sequencing, promoted from the S&P MidCap 400 Index. In Q2 2026, the company reported revenue of $1.159 billion, up approximately 9% year-over-year.
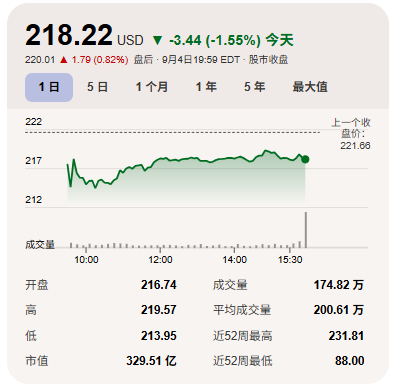
Illumina (ILMN) – Latest Stock Price
Product revenue reached $982 million, driven by sequencing consumables and instrument demand. As of September 4, 2026, ILMN closed at $218.22, up approximately 66% year-to-date, with a market cap of approximately $32.95 billion and a trailing P/E ratio of approximately 40.64x.
Everpure (P)
An enterprise data storage and AI data intelligence solutions provider, also promoted from the S&P MidCap 400. In Q2 2026, the company reported revenue of $1.19 billion, up 37.7%year-over-year, beating analyst expectations of $1.1 billion. On August 10, Everpure announced a design partnership and supply agreement with a second top‑5 global hyperscale data center operator, with meaningful revenue contributions expected from fiscal 2028 onward.
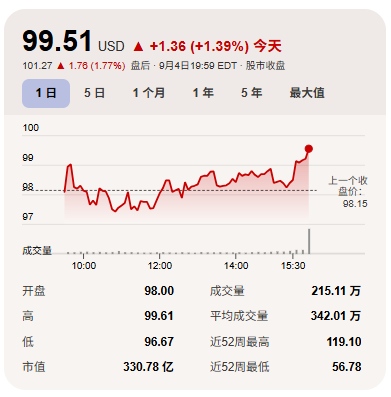
Everpure (P) – Latest Stock Price
As of September 4, 2026, P closed at $99.51, with a market cap of approximately $33.08 billion and a trailing P/E ratio of approximately 136.32x.
| Asset | Ticker | Latest Price | Change |
|---|---|---|---|
| Bloom Energy | BE | $277.22 | +$24.35 |
| Illumina | ILMN | $211.06 | -$7.16 |
| Everpure | P | $101.14 | +$1.63 |
Three Removals:
Molson Coors Beverage (TAP) – moved to the S&P SmallCap 600
The Trade Desk (TTD) – moved to the S&P SmallCap 600
Builders FirstSource (BLDR) – moved to the S&P SmallCap 600
Our take: Looking at the full 2026 rebalancing cycle, AI infrastructure and semiconductor companies are steadily replacing traditional consumer and industrial names in the S&P 500. This is the most tangible evidence yet of AI reshaping the US economic structure.
S&P 500 Concentration Risk Analysis
As the weightings of top companies continue to climb, S&P 500 concentration has reached historic extremes. As of July 31, 2026, the top 10 constituents together account for 41.37% of the total index. Bloomberg ETF analysts have noted that while the top 10 represent 39% of the index weighting, they contribute 41% of the index's earnings.
Our findings: After reviewing multiple sources, we note that the S&P 500 is "no longer a diversified index." The profit share of the top 10 constituents has nearly doubled since 1996. This concentration is driven by multiple factors—passive inflows into market-cap‑weighted ETFs, investor enthusiasm for the AI sector, and expectations of sustained growth.
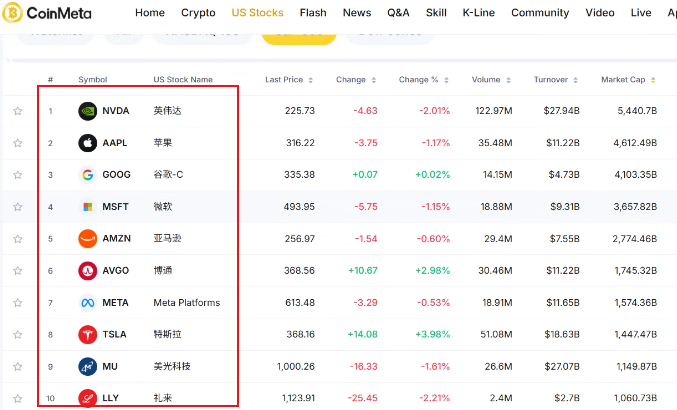
Coinmeta US Stocks Section – S&P 500 Top 10
Our view: When the AI boom eventually fades or faces regulatory headwinds, this extreme concentration could trigger volatility risks beyond market expectations. Understanding which companies are in the S&P 500 and how weightings are distributed is not just the starting point for investing,it is an essential component of risk management.
FAQ: Common Questions About S&P 500 Constituents
Q1: Does the top-weighted company in the S&P 500 change frequently?
A: Not frequently, but industrial shifts can drive major changes. While the index is reviewed quarterly, the weightings of top companies tend to be relatively stable. However, when industrial revolutions like AI occur, rankings can change dramatically,Nvidia, for instance, rose from outside the top 10 to the top spot in just two years.
Q2: Does a stock always drop when it is removed from the S&P 500?
A: Not necessarily,removal does not directly equate to price decline. Removals typically result from market cap shrinkage or reduced sector representation, but if the company's fundamentals remain sound, the stock may show resilience. Removals often trigger passive selling and short‑term volatility, but long‑term performance depends on profitability and business outlook.
Q3: Why is the S&P 500 a better representation of US stock market performance than the Dow Jones?
A: Because the S&P 500 has broader coverage and uses market‑cap weighting, making it more representative. The Dow Jones includes only 30 stocks and uses price‑weighting, making it susceptible to manipulation by high‑priced stocks. In contrast, the S&P 500 covers roughly 80% of the US market, and the performance of its top 5 companies often directly determines the direction of the broader market.
Conclusion
Understanding the shifting S&P 500 top 5 companies is, in essence, grasping the rulebook of US equity pricing power. From consumer electronics to AI computing power, the reshuffling of top weightings reflects the broader industrial waves of our era.
But the flip side is clear: as the S&P 500 becomes increasingly concentrated in a handful of tech giants, investors must remain vigilant against the risks of over‑concentration. In an age of passive investing, rather than blindly dollar‑cost averaging, it may be more practical to regularly review index weighting distributions—this could prove more valuable than trying to predict tomorrow's market direction.
Disclaimer: This content is based on publicly available market data and is for informational and educational purposes only. It does not constitute investment advice. Readers are advised to strictly comply with applicable laws and regulations. For the latest updates, follow CoinMeta.