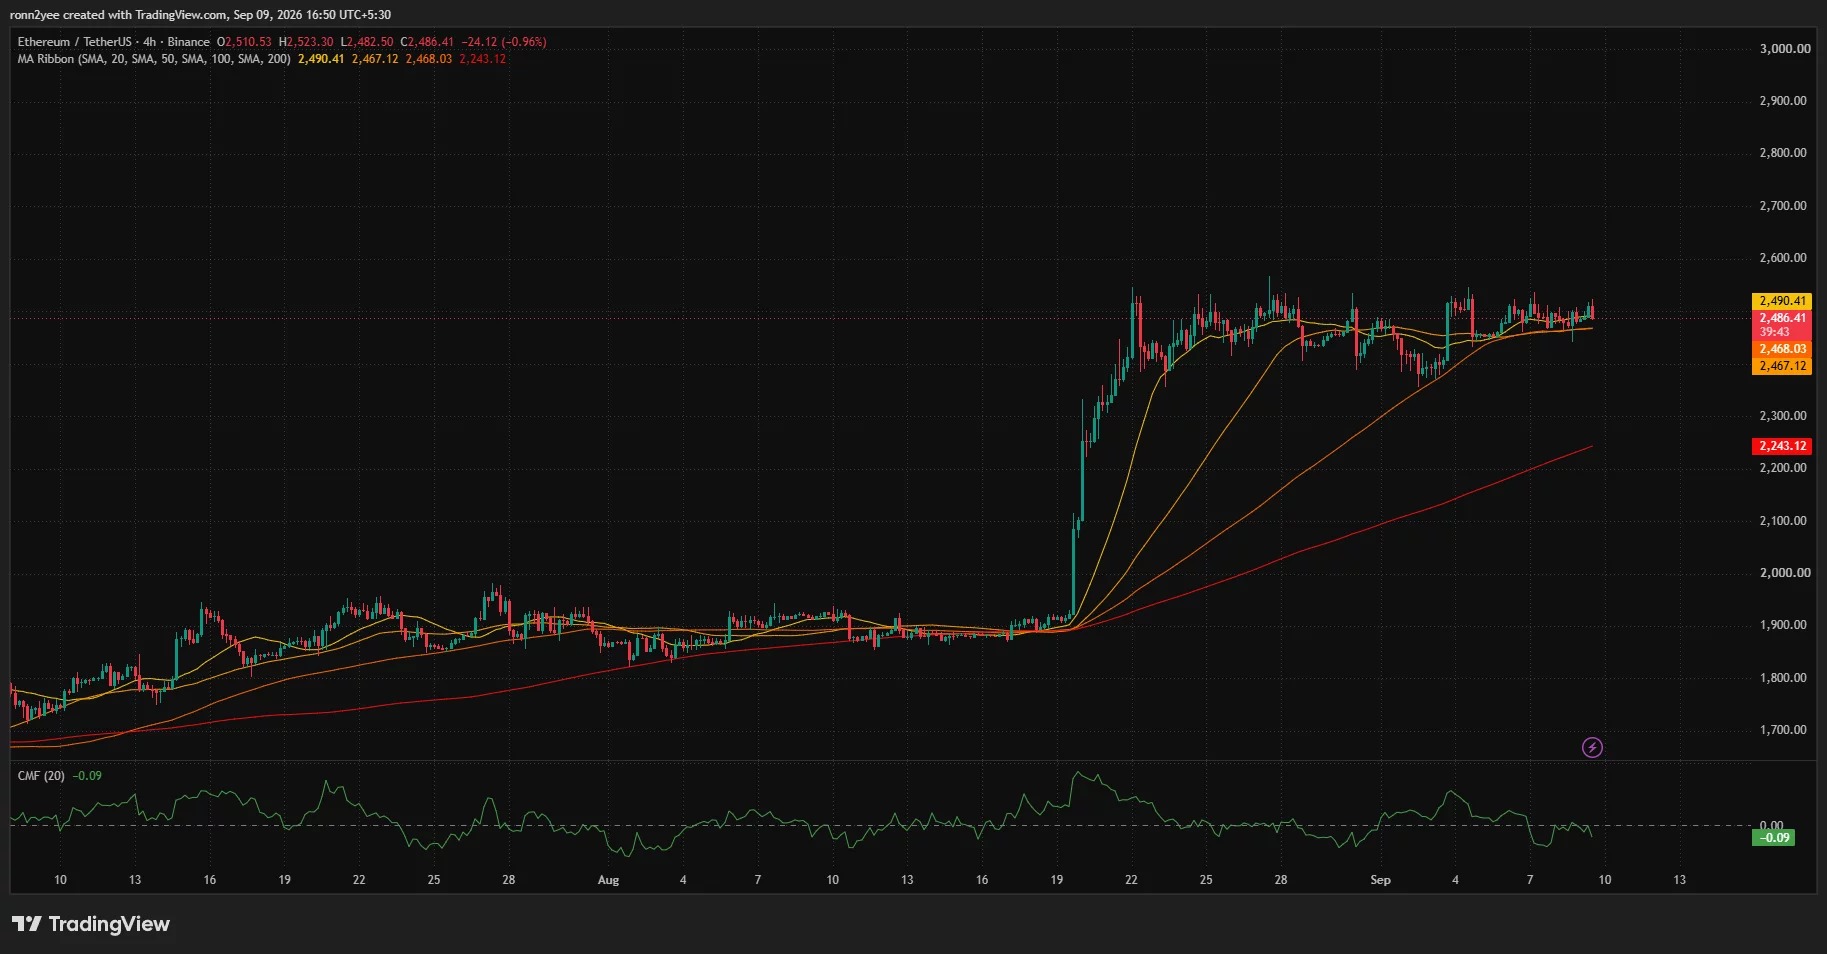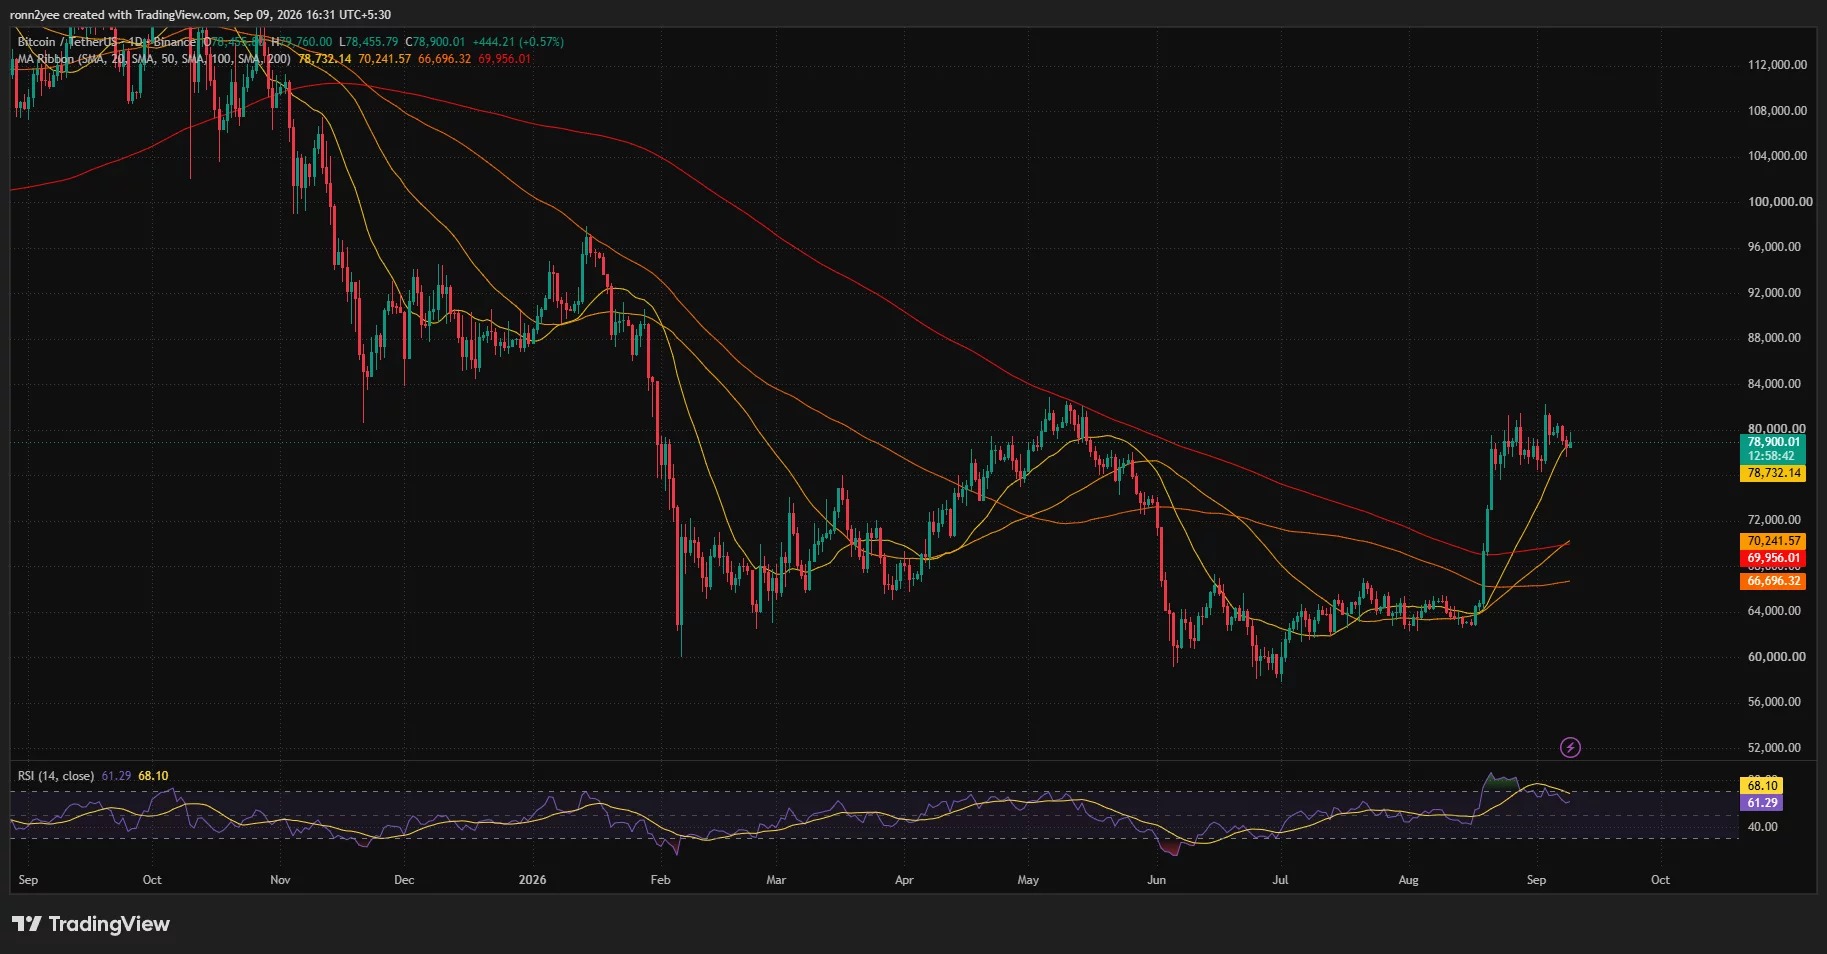







On September 9th, Ethereum struggled around the $2500 level, briefly breaking above $2520 during the session, but then quickly fell back. The current focus of the market remains on whether it can hold its ground in the range of $2525 to $2535. If the daily chart closes above this range, the short-term targets could move up to $2550 and $2600.
Recent trends show that since the rebound from around $2,430 at the beginning of September, ETH has entered a period of continuous consolidation. Buyers have repeatedly taken over at prices around $2,478 to $2,485, but each time it attempts to rise to $2,525 to $2,535, it encounters significant selling pressure, preventing the price from opening up more room for upward movement.
Resistance above $2,500 remains.
From the 4-hour chart, ETH has fallen below the 20-week moving average of $2490, indicating an increase in short-term buying pressure. However, the price is still above the 50-week and 100-week moving averages, which are currently around $2467 to $2468; this area serves as initial support.
If it falls below this area of concentrated moving averages, the market may retest the lower range of $2,435 to $2,445. If the selling pressure continues to increase, the $2,350 to $2,360 range could also come into focus again. In contrast, the 200-week moving average is still at $2,243, indicating that the medium-term structure has not yet been broken.
Weak capital flow and weak demand for ETF
The resistance to the breakthrough of ETH is not just technical. The Chaikin Money Flow indicator over a 4-hour period has dropped to -0.09, indicating that short-term funds are still flowing out. Even if the price briefly returns above $2,500, if the capital flow does not improve, the sustainability of the breakthrough will still be put to the test.
At the same time, there was a outflow of funds from spot Ethereum ETF, which weakened some of the institutional demand. Before the Federal Reserve's interest rate meeting on September 15th to 16th, the overall risk appetite in the market was also weak. The conflict between the United States and Iran drove up energy prices, further exacerbating inflation concerns.
In addition, the U.S. Senate is expected to proceed with a procedural vote on Clarity Act on September 15th, and regulatory uncertainties have also led some institutions to maintain a cautious stance. This makes it difficult for ETH to break away from the overall risk-averse trading atmosphere in the crypto market.
Liquidity is concentrated around 2430 and 2550.
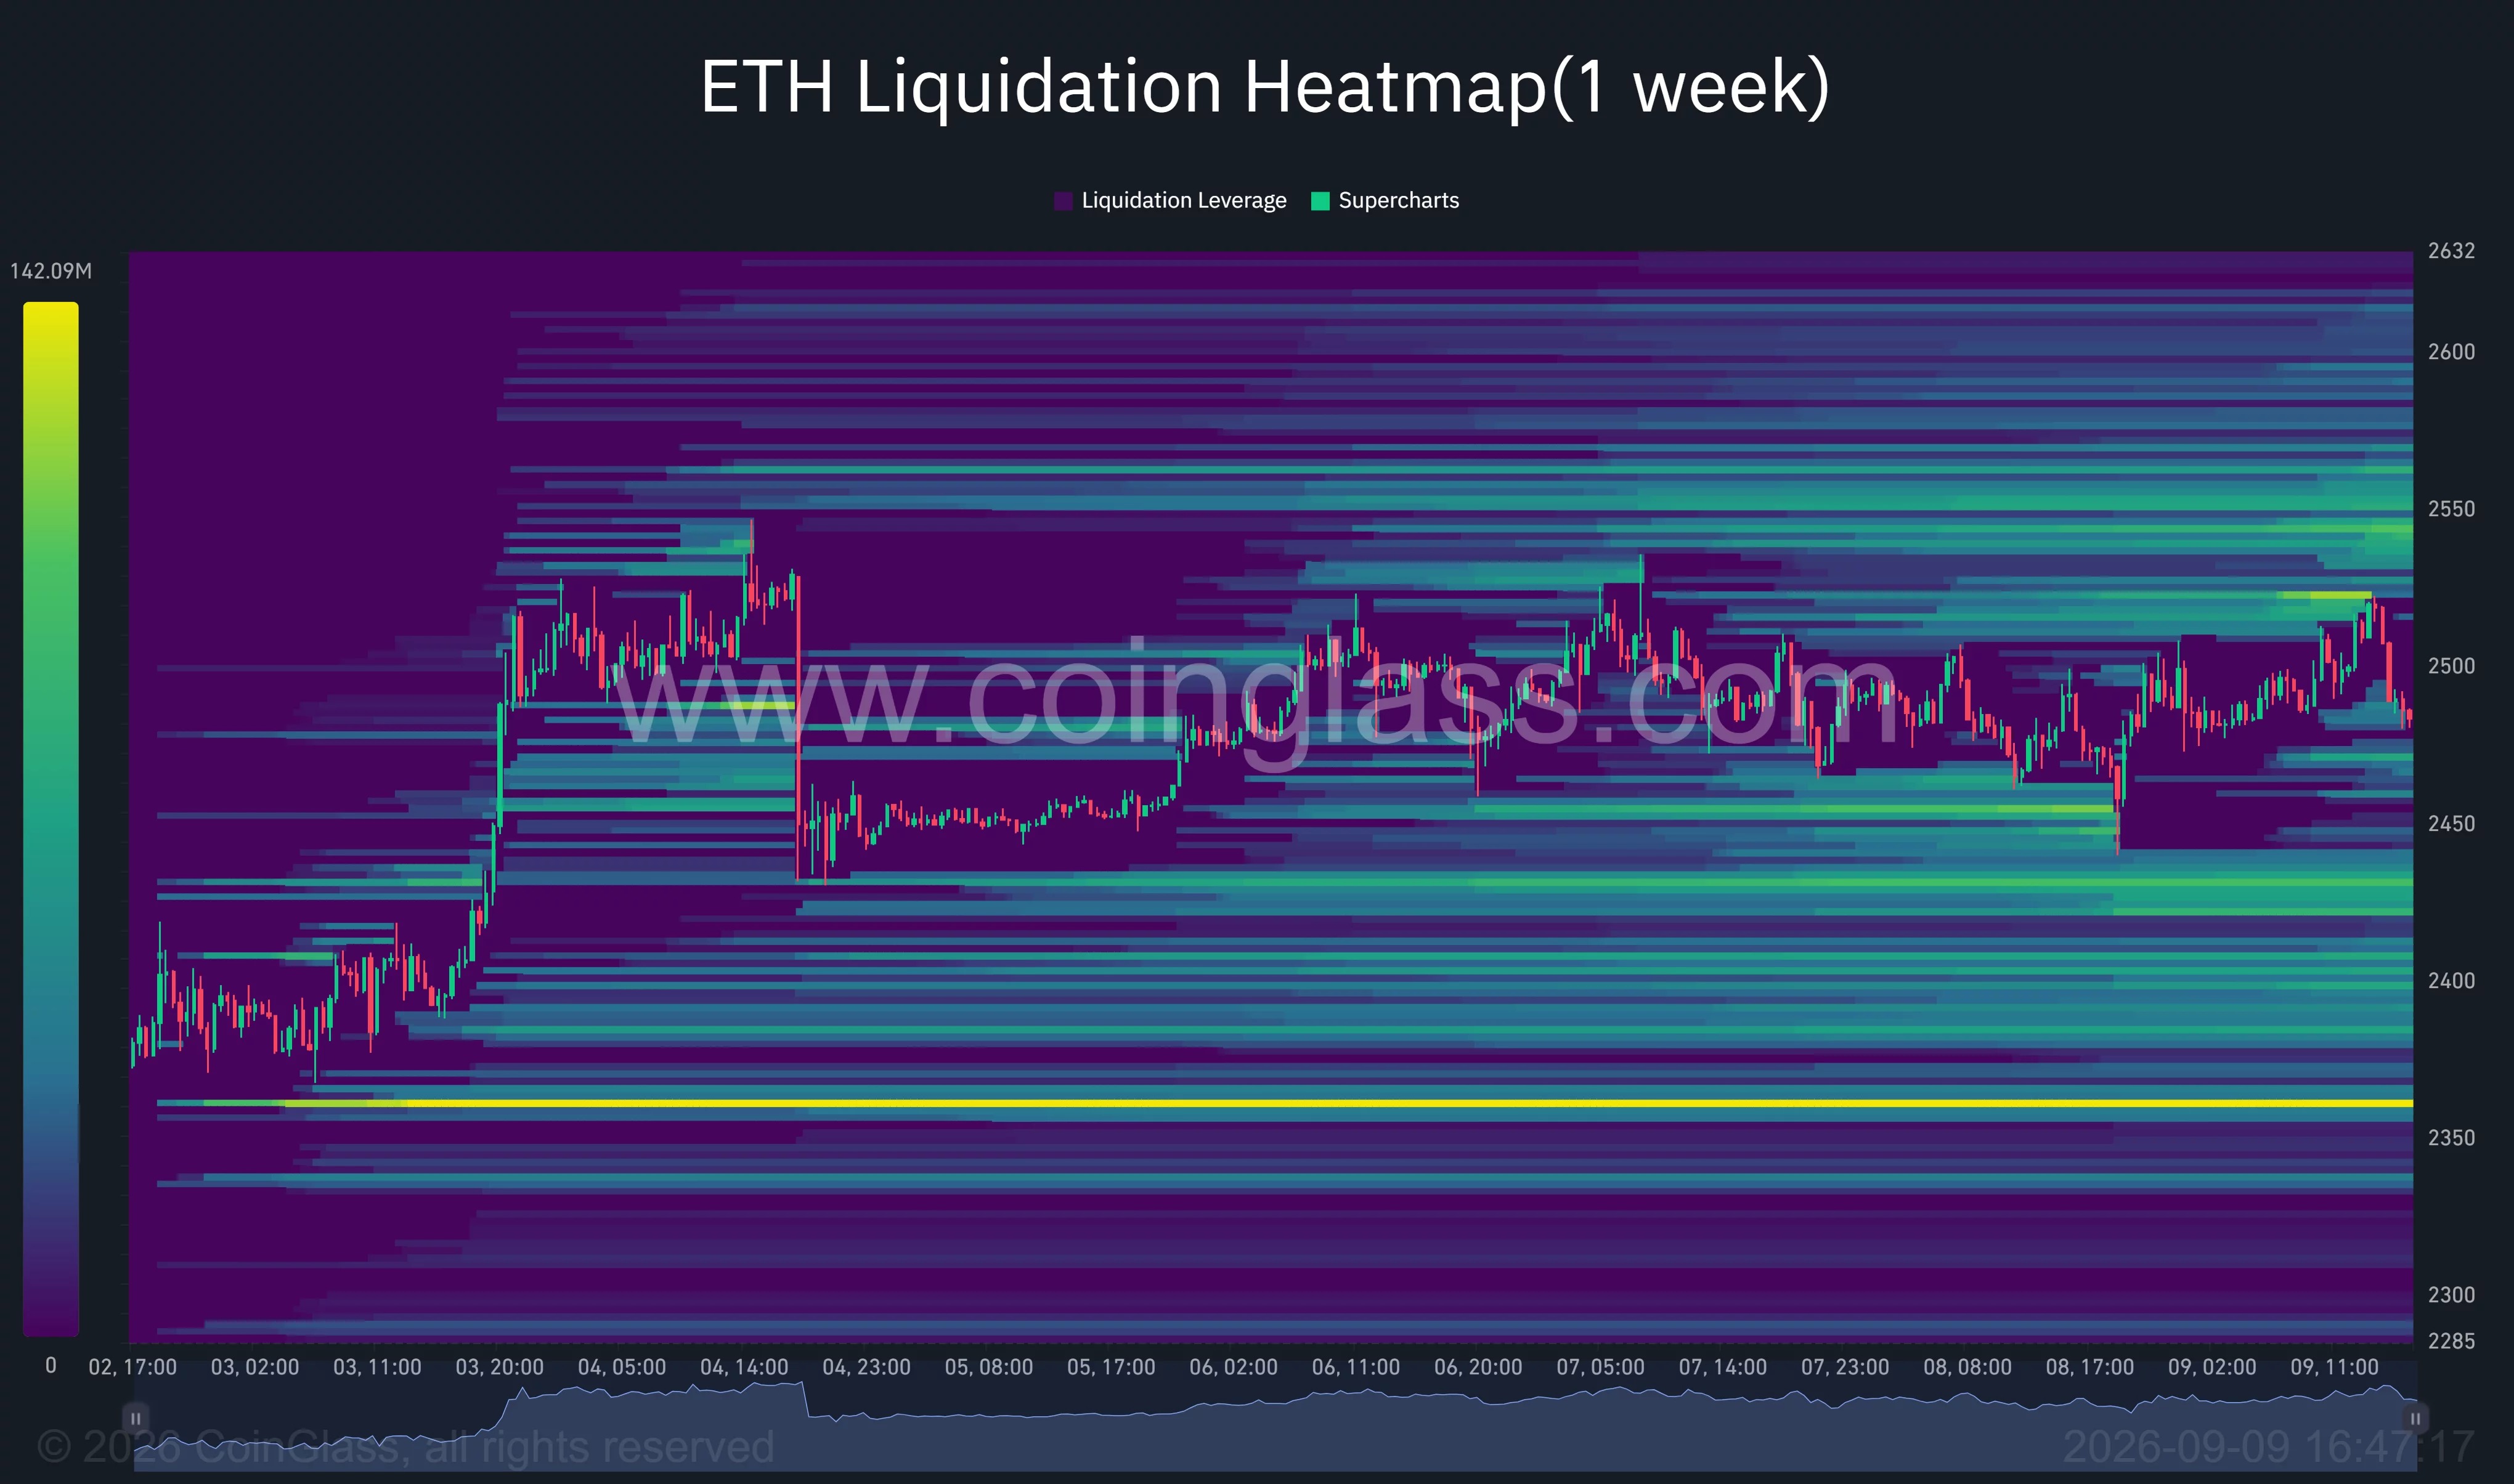
The CoinGlass one-week liquidation heat map shows that there are a considerable number of leveraged positions on both sides of the current ETH price. The nearest area with concentrated liquidations above is between $2520 and $2550; if the price enters this range, it may trigger some short covering, providing additional momentum for the market. However, this area is also where spot sell orders frequently appear.
The higher level of liquidity is concentrated between $2580 and $2610. To reach this range, ETH needs to effectively break through $2535 first and then consolidate above $2550. Below that, the main focus is on $2430, as well as the even lower range of $2355 to $2365.
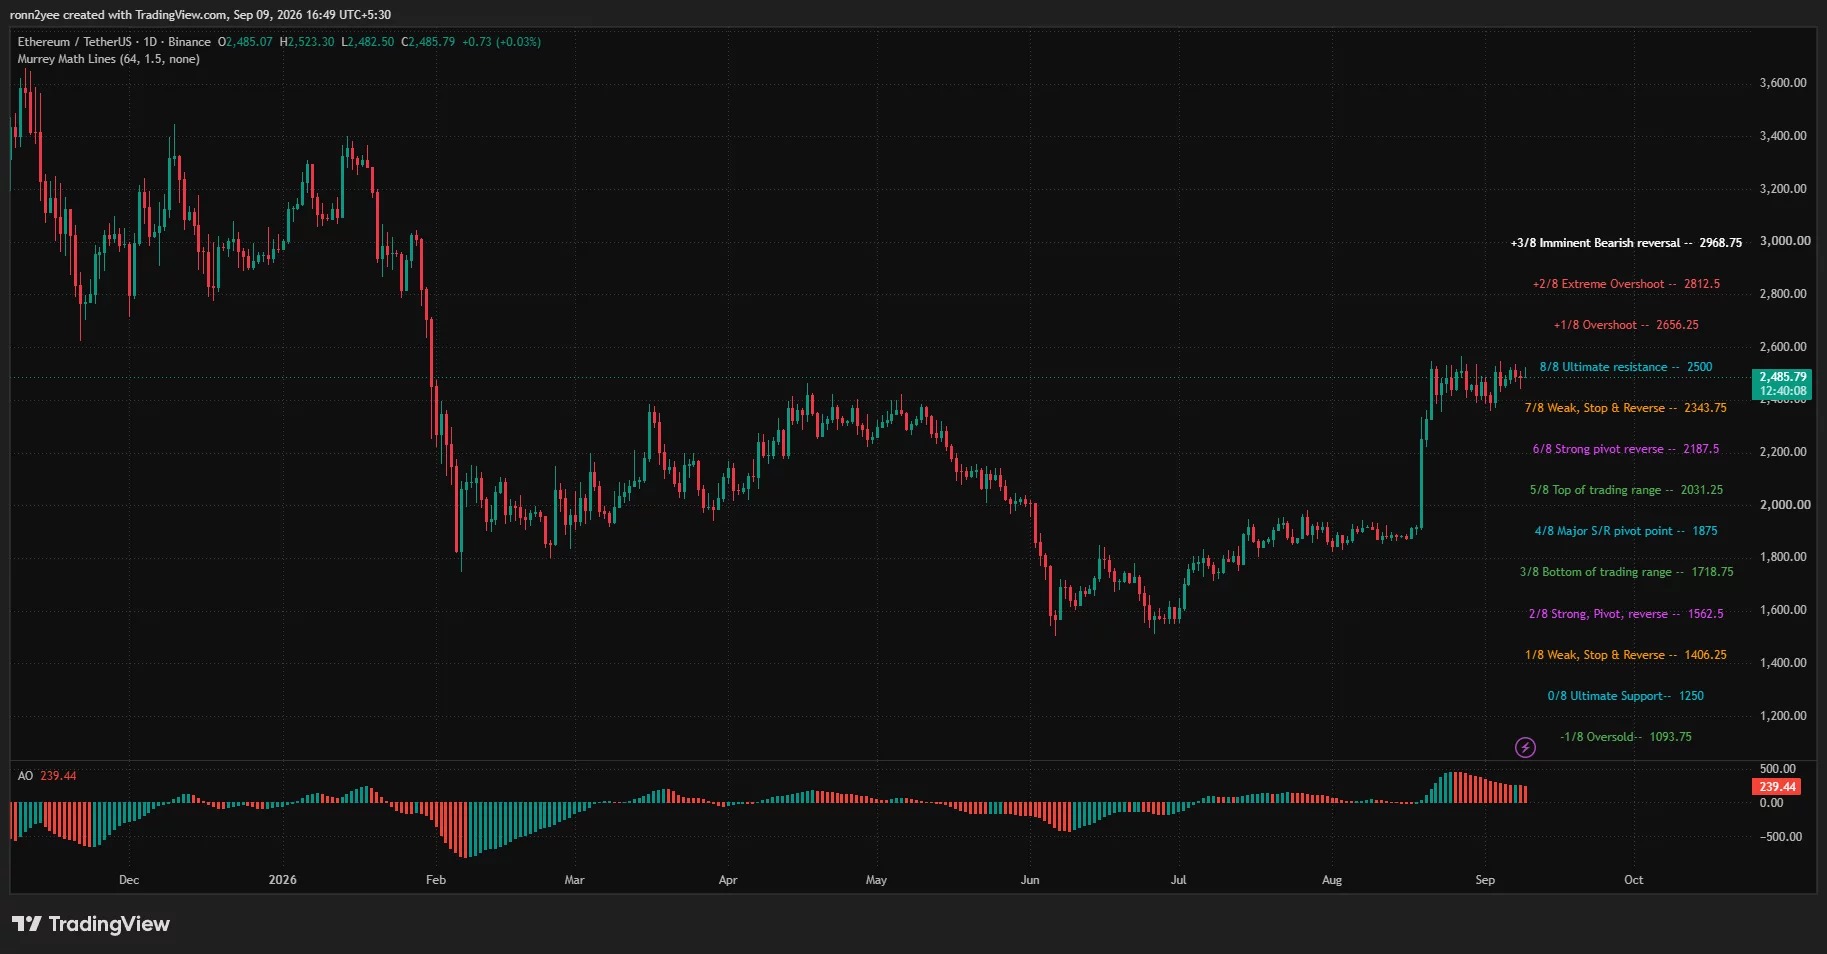
Market analysts believe that the range of $2,478 to $2,485 remains a key support level in the short term. If this area is lost, ETH could revisit $2,445 and $2,430; however, if the daily chart closes clearly above $2,535, $2,550 and $2,600 will become the main targets for observation in the next phase.