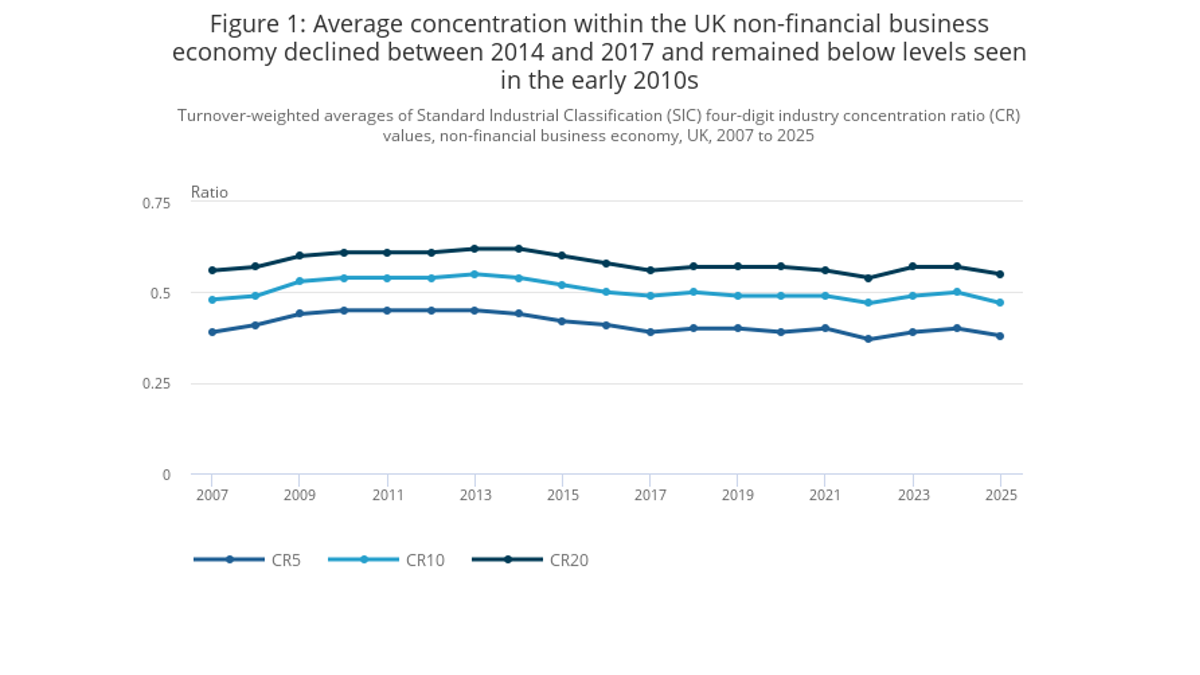
On October 13th, the Office for National Statistics (ONS) in the UK released a set of long-term statistics on industry concentration, which observed the share of turnover of large enterprises in various sub-sectors of the UK's non-financial business economy from 2007 to 2025. The most notable figure is the weighted average turnover of the top five enterprises' concentration CR5, which decreased from around 0.45 in 2010 to around 0.38 in 2025. The Herfindahl-Hirschman Index HHI also fell from around 1075 to around 700 under the same measurement criteria. This is not a single-month price news item, nor is it a conclusion that "all markets in the UK have suddenly become perfectly competitive." Instead, it is a developmental statistic that attempts to use micro-data on enterprises to answer questions regarding long-term industrial structure.
When discussing whether "a few large companies are becoming increasingly powerful," people often use market capitalization, social media attention, or the presence of a few platforms around them as evidence of the entire economy. The value of this set of data ONS lies in replacing intuition with trackable indicators: How much total turnover do the five largest companies in a niche industry account for? Are changes in market share common, or are they driven by a few specific industries? The report shows that the period of significant overall decline was concentrated between 2014 and 2017, after which the overall changes have been relatively mild. It challenges the simplistic narrative that "enterprise concentration will inevitably increase year by year" and also reminds readers not to use macro averages to obscure the high levels of concentration that may exist in individual industries.
How can the top five players in an industry become the entire economic landscape?
CR5 calculates the proportion of the turnover of the top five companies in a certain industry relative to the total industry turnover. A value of 0.45 indicates that, using this statistical method, on average, the top five companies account for about 45% of the total turnover; by 2025, this proportion is expected to drop to around 38%. However, the "average" here is not calculated by simply adding up the figures of each industry, but rather by weighting the turnover based on the size of each industry, with larger industries having a greater impact on the overall total. Researchers also use HHI to examine market share distribution: this method involves squaring each company's market share and then summing them up, making it more sensitive to markets where a few giants hold a particularly prominent position. Both indicators point in the same direction, enhancing the credibility of the description of a long-term decline, but they do not prove that every niche market is declining at the same rate.
ONS Observing enterprises under four-digit industry classifications provides a unified framework for statistics, but this does not equate to what regulatory agencies define as a 'relevant market.' A company may operate across regions and products; substitutes in the eyes of consumers may not necessarily fall under the same classification code. An industry that appears dispersed nationwide may have only a few suppliers in certain areas; conversely, an industry that seems concentrated in statistics may actually allow consumers to turn to alternative services outside that classification. This is a crucial factor that must be taken into consideration when directly translating concentration into market dominance. ONS The official blog also reminds us that there is no one-to-one correspondence between concentration and the strength of competition, or whether consumers are harmed as a result.
Upon closer examination of the temporal changes, what is most valuable is not just comparing the endpoints of 2010 and 2025, but rather when the decline occurred. If the main changes took place between 2014 and 2017, while the recent years have been relatively stable, then the claim that "enterprises suddenly lost their monopoly in 2025" does not hold water. There may be multiple factors at play during this period, such as companies entering and exiting the market, updates to industry classifications, changes in turnover, and mergers and acquisitions. Statistics themselves do not provide a single causal explanation for each industry. Even if the overall indicators show a decline, certain digital platforms or public services that are of great public concern may exhibit different trends. Averages answer the question of "how is it overall," while industry-specific data helps to identify where the differences lie. In policy discussions, this distinction is often more important than the overall trend.
Why a decrease in concentration does not necessarily equate to a decrease in living costs
Changes in the corporate scale structure can affect the competitive environment, but the actual prices faced by residents are also influenced by energy costs, wages, taxes, import prices, productivity, and regulatory rules. Even if the market share of the top five companies in an industry declines, new entrants may not immediately lower prices; if demand grows rapidly, each company's turnover can increase, and a more dispersed market share does not necessarily mean that established firms have shrunk in absolute terms. Conversely, in some highly concentrated industries with price regulation or intense potential competition, it cannot be assumed that consumers will necessarily suffer just because of certain factors. Therefore, this set of long-term structural statistics cannot be presented as a one-size-fits-all explanation for current inflation in the UK.
This data has another use for businesses and investors: it provides a starting point for assessing the difficulty of entering an industry and the advantages of scale. If a business is considering entering a particular niche market, it can first check whether the largest company’s share of the market is stable over the long term, and then consider factors such as local market distribution, customer switching costs, brand impact, and supply chain barriers. Investors need to determine whether the decline in market share is due to innovation by new competitors or a shift in industry demand towards other types of products. Policy makers reviewing mergers and acquisitions also require more detailed evidence regarding the relevant market, pricing behavior, and consumer welfare, rather than simply relying on the national average CR5 as a conclusive factor. These indicators are more like a map that indicates areas worthy of further investigation, but they cannot replace on-site assessments.
The report also has methodological limitations. ONS refers to this as developmental statistics, which means that the definitions, data processing, and user feedback can still be improved. The data is primarily based on the non-financial business economy and does not provide a comprehensive portrait of all sectors of society. Changes in corporate registration, group structures, and industry classifications over different years need to be taken into account when interpreting long-term trends. When readers cite figures ranging from 0.45 to 0.38, they should also specify the year, the indicator, and the scope of coverage; if one simply states that “the degree of monopoly in the UK has decreased by seven percentage points,” it could lead to misunderstanding the average share of turnover as a legal determination for the entire market. To make comparisons with the United States or other European countries, it is also necessary to ensure that the industry definitions and corporate levels are sufficiently similar.
A more cautious and valuable conclusion is that, according to the newly released statistical method ONS, the weighted average concentration of turnover in the UK's non-financial business economy has been declining over the long term, and this decline has not been as rapid in recent times as it was in the earlier years. This provides a testable counterexample to the intuition that "businesses are becoming increasingly concentrated," while also raising a number of issues specific to different industries. The next step should be to examine which sectors differ from the overall trend, whether consumers have indeed gained more choices, and whether there has been a corresponding improvement in prices and productivity. The statistics raise the starting point for discussion, but they do not provide a final verdict on market competition.
Image sources: Office, for, National Statistics (original report Figure 1); Based on the source annotations of Open Government Licence and v3.0, the images are only scaled to their original proportions with some white space added.