















Key Points to Note
- Chainlink ( LINK ) holds support around $11.00
- Near Protocol ( NEAR ) has a healthy structure, but there is a short-term pullback.
- Binance Coin ( BNB ) Hold the range between $690 and $700
- Bitcoin ( BTC ) tests support at $76,000
Key Points to Note
- Chainlink ( LINK ): Currently, the trading price is around $11.61, and we are testing the support level around $11.00. In the short term, the outlook seems neutral to bearish.
- Near Protocol ( NEAR ): Currently around $4.40, the long-term chart structure is healthy, but it is essential to hold the range between $4.00 and $4.20 to avoid further declines.
- Binance Coin ( BNB ): Currently around $714, holding the support range of $690 to $700. The short-term outlook is neutral to bearish.
Chainlink ( LINK ) Hold the support around $11.00
Chainlink is currently trading at around $11.61, which represents a significant decline from the high of nearly $15.75 at the end of September. On the daily chart, the previously strong upward trend has turned into a corrective consolidation, and the current price is testing support levels.
The bullish reversal of LINK began in August. It broke through the main moving averages and rose from around $8.00 all the way to $15.75. The subsequent decline resulted in lower highs and lower lows, and the short-term momentum also deteriorated accordingly.
The current price has fallen below the shorter-term moving averages, which are concentrated around $12.00 to $12.60. Therefore, bears still control the near-term trend. However, LINK remains above the 200-day moving average at around $11.00. As long as this remains the case, a larger-scale rebound structure is still valid.
The first support level is between $11.40 and $11.50. Below that is the psychological barrier of $11.00. If this level is effectively broken through, the range of $10.40 to $10.60 will come into view; buying interest has recently appeared there.
The resistance above is first at $12.00 to $12.20, and the supply zone above that, from $12.50 to $12.70, represents an even stronger obstacle. If the price reclaims these levels, there is a greater possibility of a rebound towards $13.30.
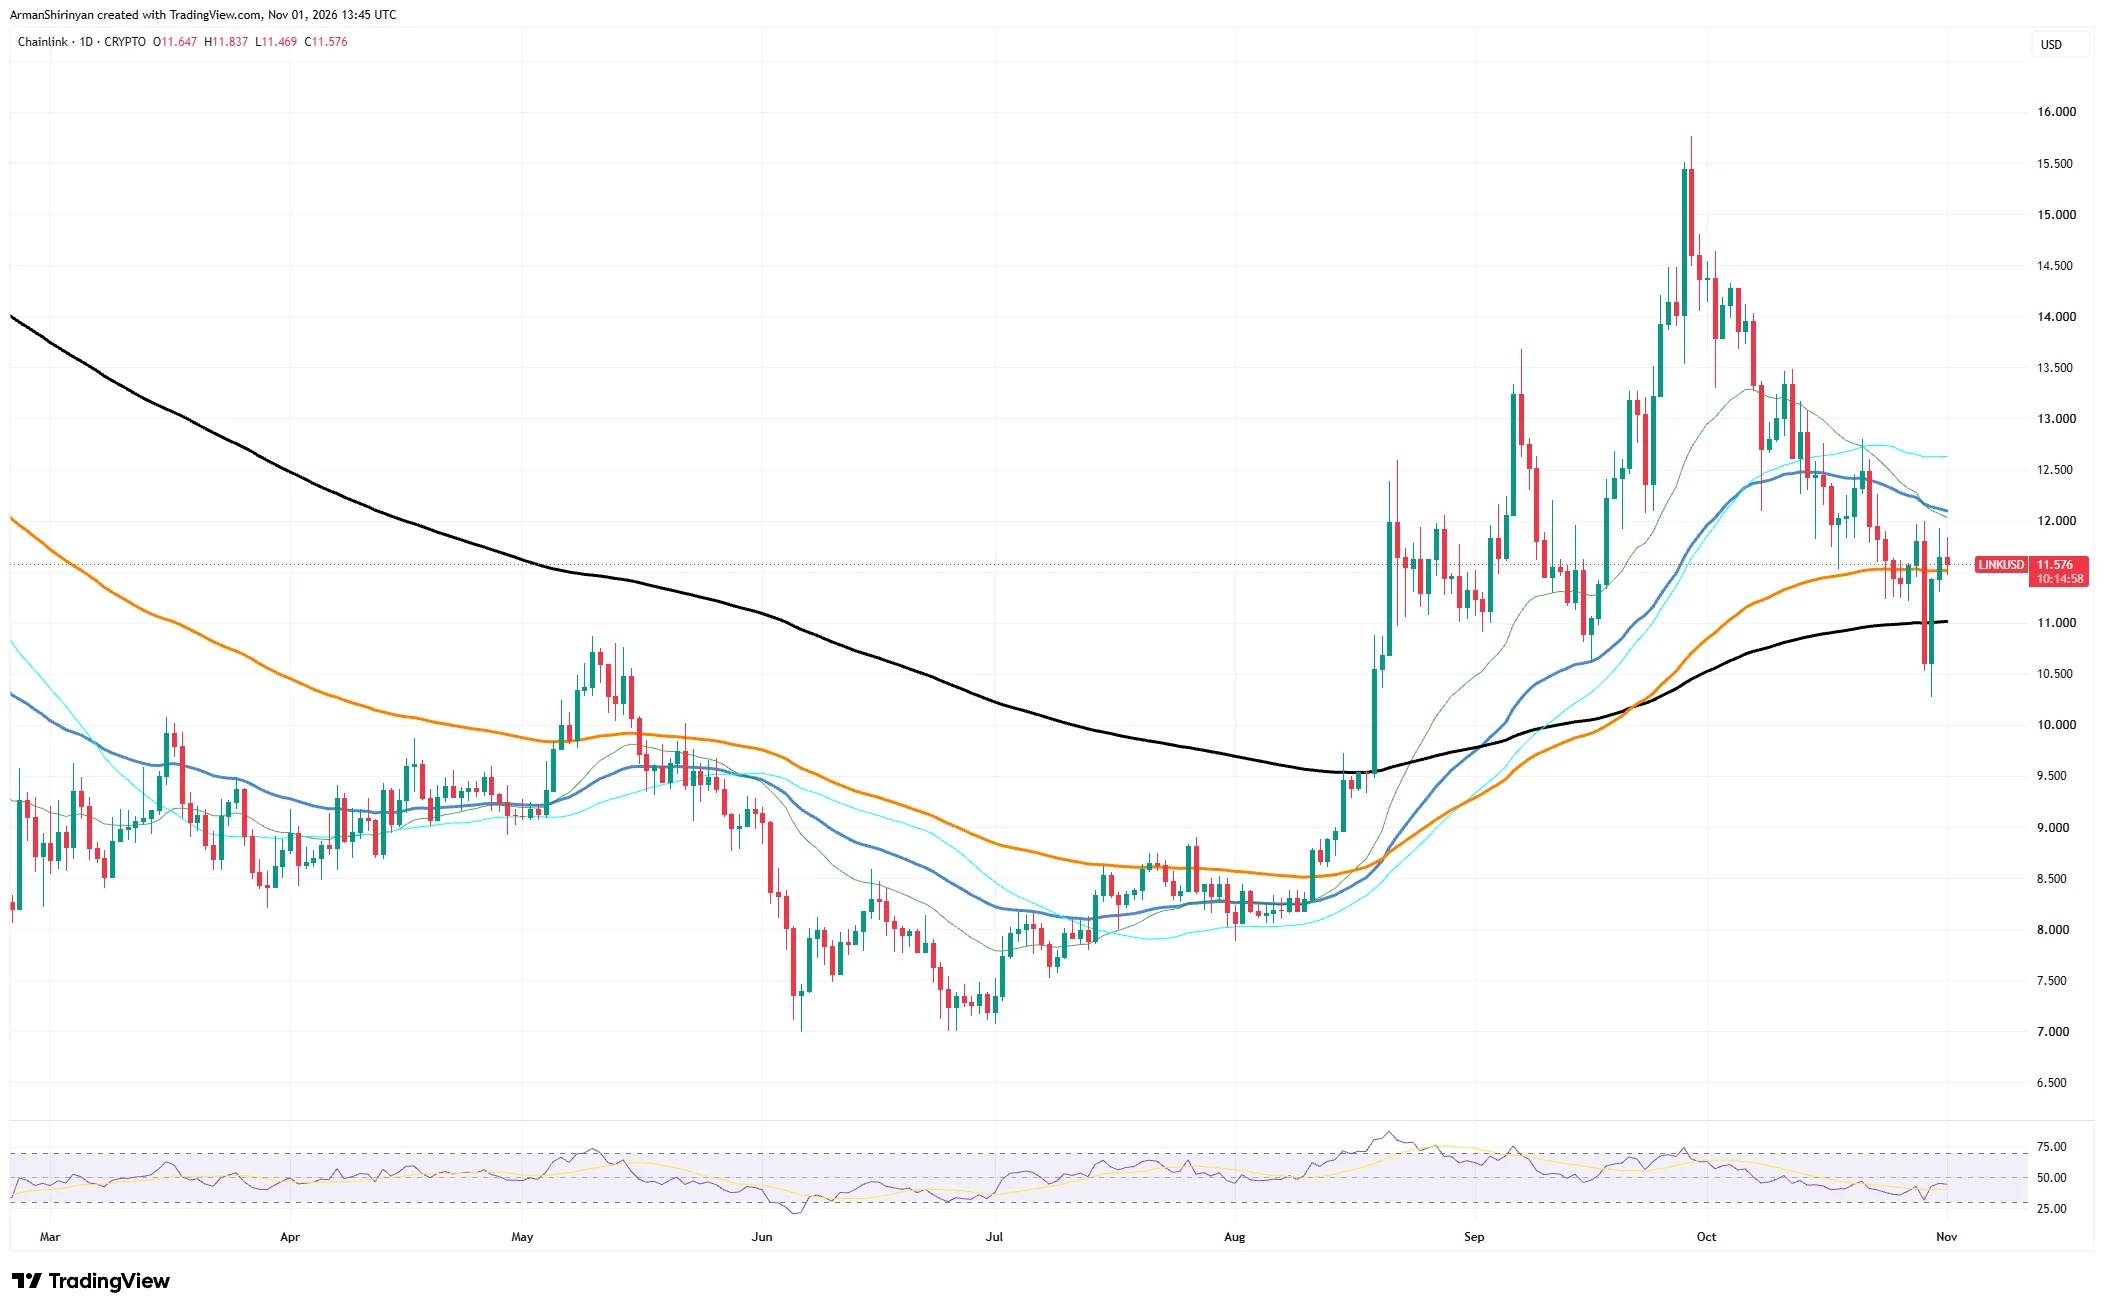
On the daily chart, RSI is around 40 to 45, indicating a neutral to slightly weak area. The buying momentum is not strong, but LINK is also not in a state of severe oversold conditions.
Recently, the price dropped rapidly to around $10.30, before rebounding above $11.50. This may indicate that demand is absorbing the selling pressure. However, a single K-line that refuses to fall does not confirm a reversal.
In the short term, LINK remains neutral to slightly bearish. The real direction for the next step may be determined by support at $11.00 and resistance between $12.20 and $12.70.
Near Protocol ( NEAR ) has a healthy structure, but there is a short-term pullback.
The breakthrough of NEAR occurred in September. It quickly broke through several resistance levels and rose to around $6.00 at the beginning of October, with trading volumes far higher than usual, indicating that a large amount of capital was involved.
Since that high point, prices have been in a corrective phase: lower highs, and repeated tests of the support range between $4.20 and $4.40.
Currently, NEAR is trading below the short-term moving average, with resistance levels around $4.50 to $4.80. The medium- and long-term moving averages are still upward and located far below the current price, so the broader bullish trend does not seem to have been disrupted yet.
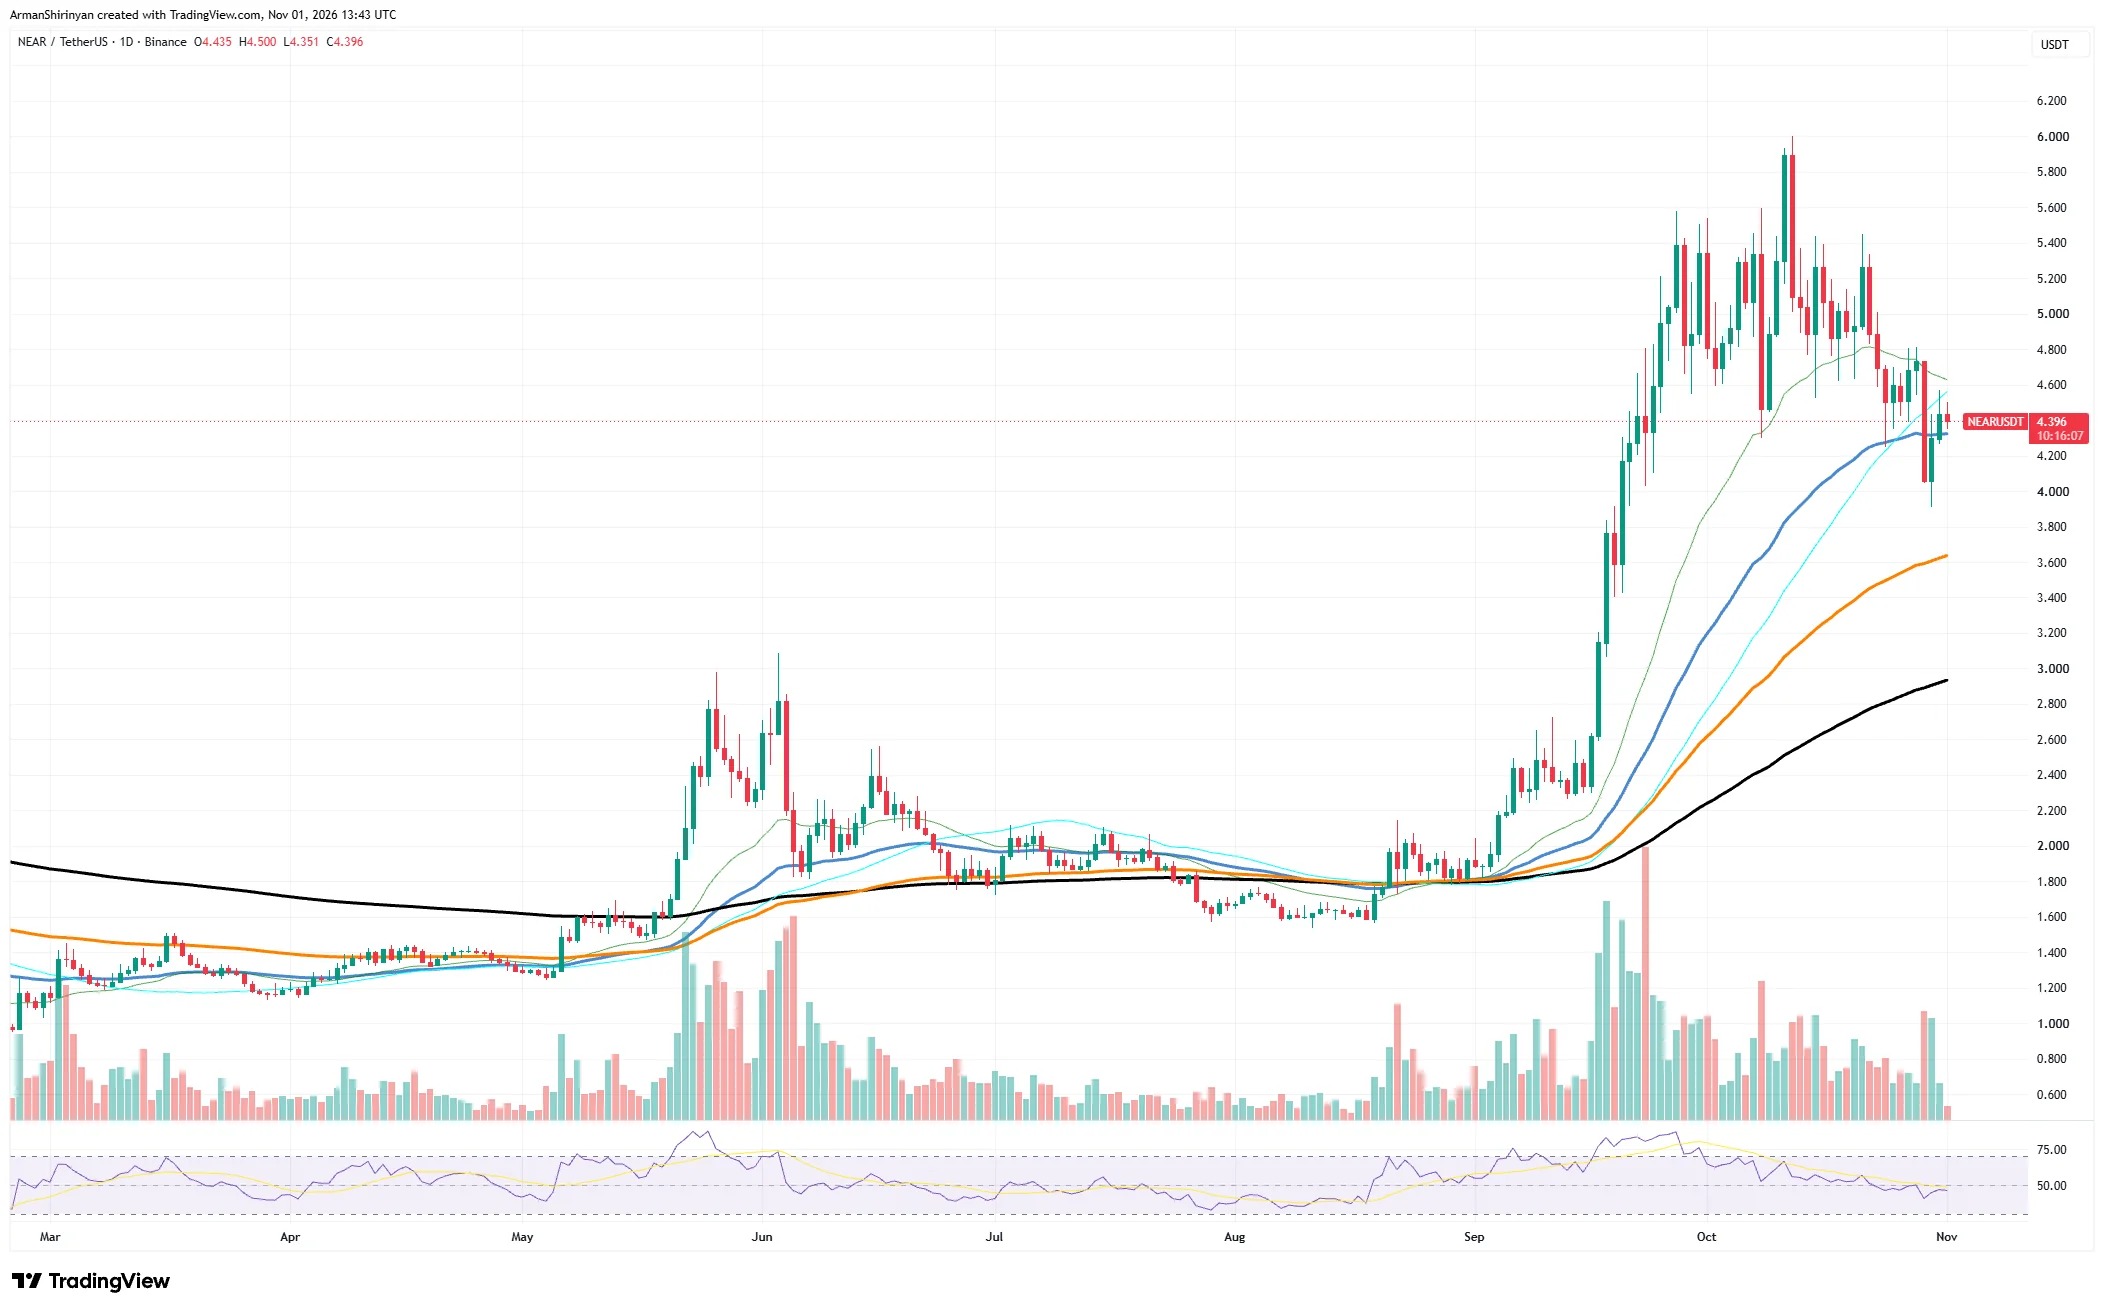
The first support level is between $4.20 and $4.30, which is also the area that has been repeatedly tested during the recent consolidation.
Further down, $4.00 serves both as a psychological level and a technical support level. If this level is clearly broken through, there could be a decline to around $3.60 to $3.70, which is also the area where the longer-term upward moving average lies.
On the upside, the first resistance level is between $4.55 and $4.70, followed by $4.90 to $5.00. If it breaks through and holds above $5.00, the space towards $5.40, and ultimately $5.80 to $6.00, could open up.
In September, when there was a breakthrough, trading volume increased significantly, indicating that there was indeed real buying support at that time. Subsequently, as prices consolidated, trading volume cooled down, which suggests that speculative interest weakened.
If the daily close confirms a fall below $4.00, the possibility of a deeper pullback to $3.60, or even $3.20, will increase.
The long-term chart of NEAR remains healthy, but it is under pressure from short-term corrections. It must hold the range between $4.00 and $4.20. If it can rebound to $4.70 to $5.00, that would more strongly indicate that buyers are regaining control.
Binance Coin ( BNB ) Hold the range between $690 and $700
Binance Coin is currently near $714, showing a significant decline from the high of around $800 to $810 in October. The short-term momentum on the daily chart is weakening, but the rebound that began in August has not yet been technically broken.
BNB made a strong breakthrough in late August, rising from around $600 to $800. However, in October, the situation changed as buying interest weakened, and the price reached lower highs consecutively. The recent decline pushed BNB below the short-term moving average of $730 to $750, resulting in a bearish trend in the recent period.
Recently, BNB tested the range of $690 to $700, which coincides with the rising 200-day moving average. Subsequently, it rebounded to $714. It seems that buyers are defending this area.
Resistance is initially at $730 to $740, followed by $750 to $760. If it can continue to recover above $760, the outlook will improve, and it may open up space towards $780 to $800.
On the downside, $700 is the first support level, and $690 is the next support level. If the daily chart confirms a fall below $690, selling pressure may accelerate to the range of $670 to $650.
On the daily chart, RSI, it is around 40 to 45. The momentum has weakened, but it has not yet reached an extremely oversold level, so a technical rebound is still possible, although it requires stronger confirmation.
Bitcoin ( BTC ): Testing support at $76,000
Bitcoin is currently trading around $77,871, showing a rapid pullback from its peak of nearly $87,000 in October. The short-term momentum on the daily chart is deteriorating, and BTC is approaching a support area that could determine the direction for the next move.
The reversal in August was very strong. BTC broke through the main moving averages and rose all the way from around $63,000 to $87,000. Subsequently, in October, there was a series of lower highs due to weakening demand and accumulating selling pressure.
The price recently dipped to around $76,000, before rebounding to the vicinity of $77,900. The rising 200-day moving average crosses through the $76,000 to $77,000 range, and another medium-term moving average is also in that area, so the support at that level is quite strong.
The immediate resistance level is between $78,500 and $79,000, followed by $80,500 to $82,000. If it can continuously break through $82,000, that will strengthen the reasons for a rebound and there is a possibility of reaching again the range of $84,000 to $86,000.
If BTC loses 76,000 US dollars, the larger bullish structure will be weakened, and the likelihood of a pullback to 74,000 to 72,000 US dollars will increase.
The daily chart RSI has dropped to around 40, which indicates a relatively weak momentum, but it is also close to the range where a short-term rebound could begin.
The recent large volume of sales indicates that quite a number of traders have participated in this round of decline. Therefore, any return of buying interest needs to be confirmed.
If it is possible to hold the level between $76,000 and $77,000 and regain $80,500, it could trigger a rebound towards $82,000 to $84,000.
If the daily chart confirms a fall below $76,000, selling pressure may accelerate to $74,000, or even $72,000.
Bitcoin is testing an important long-term support area, and the short-term outlook is cautiously bearish. Holding above $76,000 is key to maintaining a larger-scale rebound structure. If it can regain $82,000, it will more clearly indicate that bullish momentum has returned.