












Brief
- XRP is in a longer-term downward trend and is expected to rebound to around $1.25 before it weakens further.
- Hyperliquid ( HYPE ) fell below $80 after a 9% decline, despite the platform having applied to become a futures broker in the United States.
- Stellar ( XLM ) tumbled to around $0.157, and if it breaks below the $1.5 support level, it could open up further downside potential.
The cryptocurrency market remains under pressure, with most major altcoins having corrected downward: within the past 24 hours, the average value of major coins has fallen by about 5%. Key price levels have not yet been breached, but despite a rebound yesterday, the overall trend remains bearish.
Bearish crossover of XRP
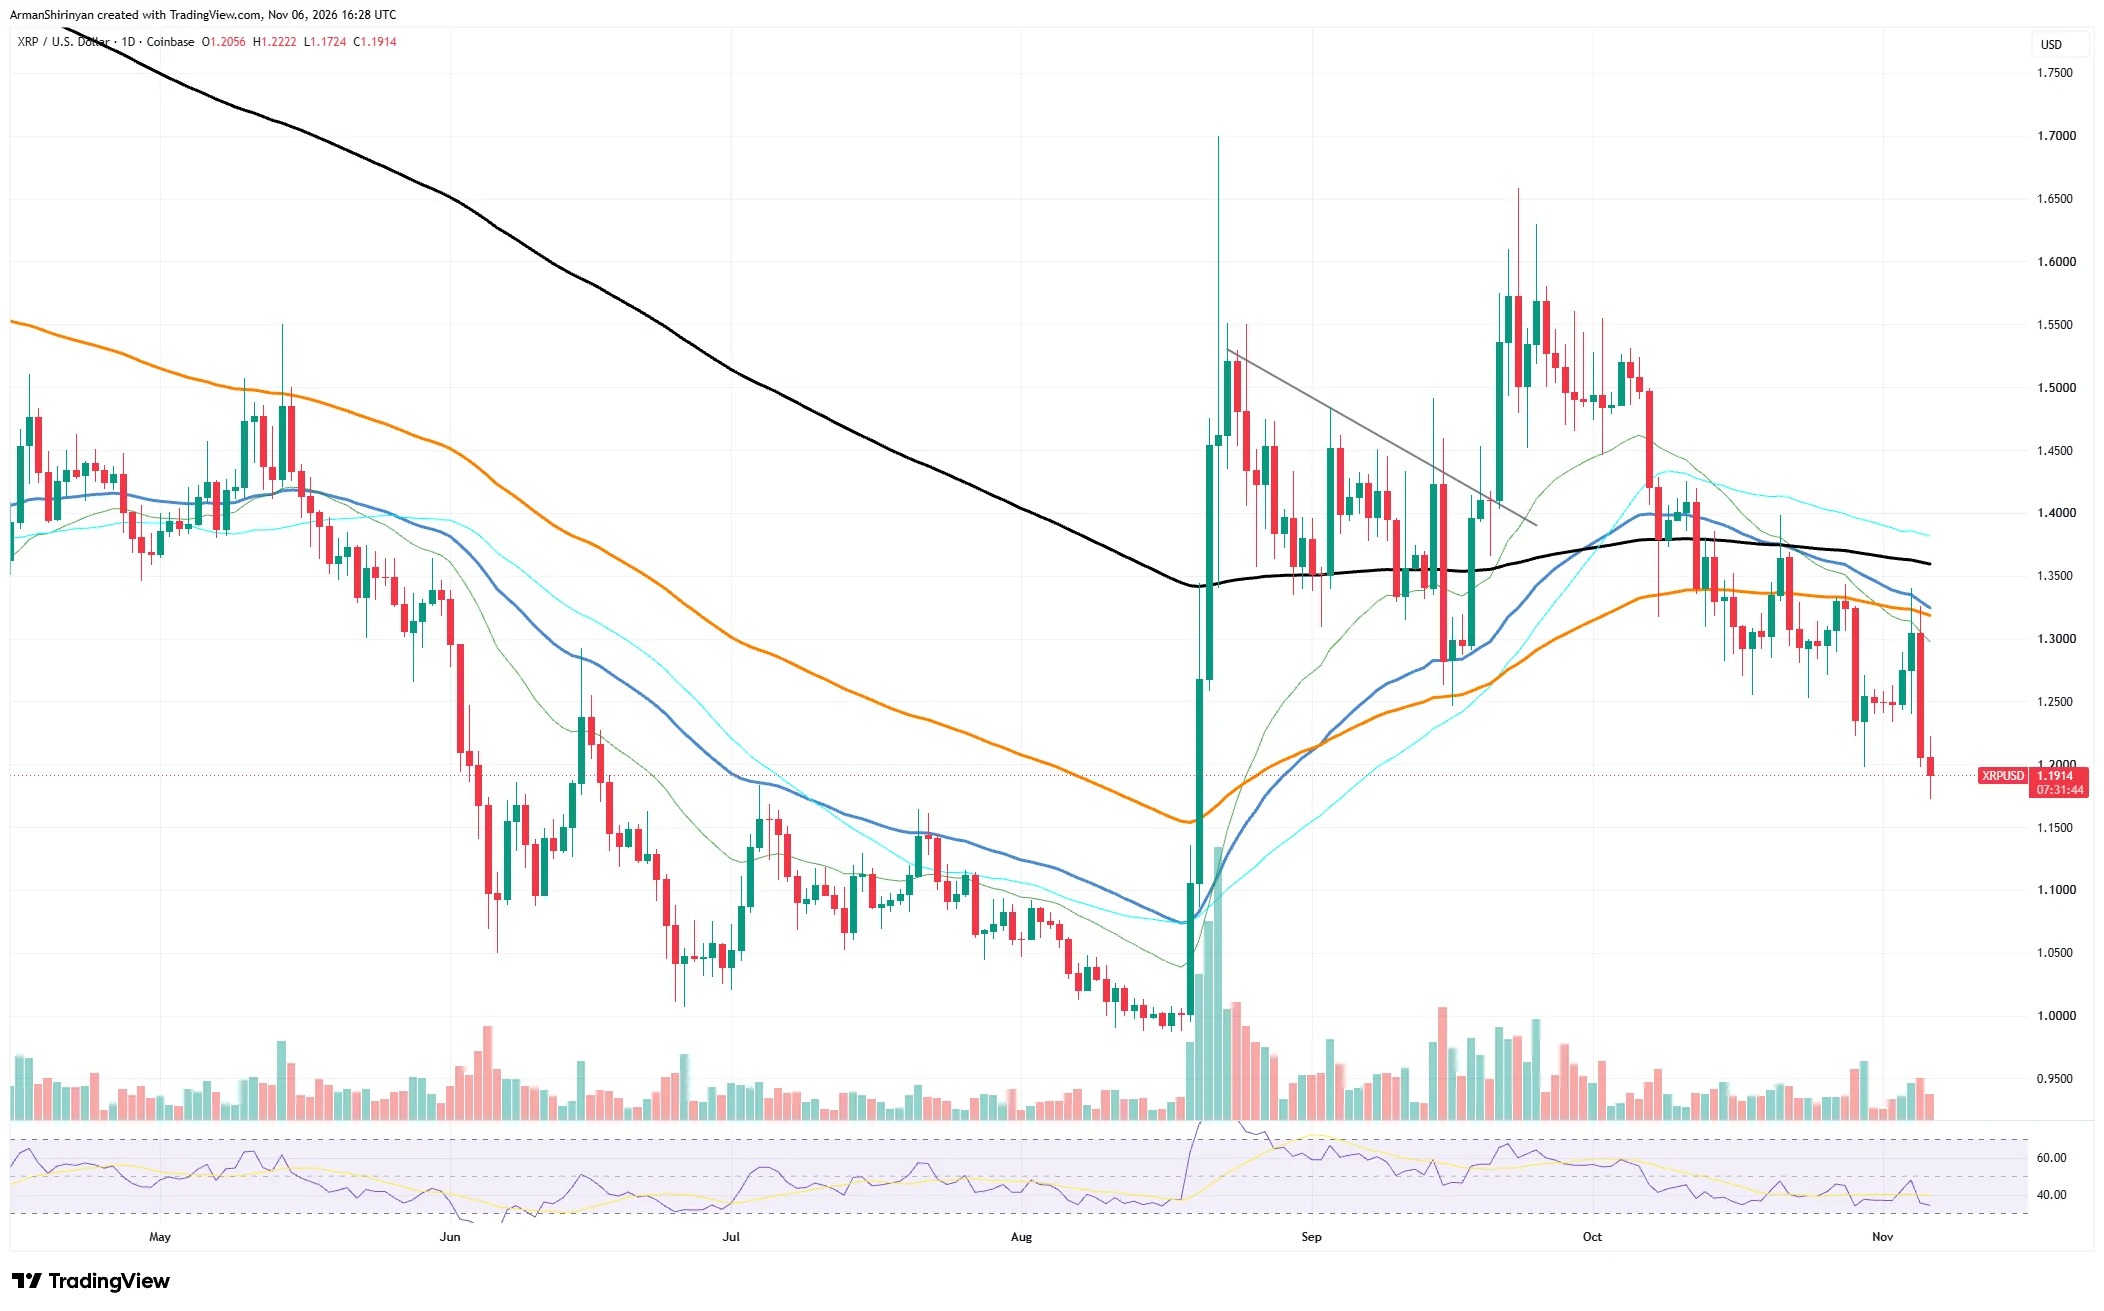
From a technical perspective, XRP has further entered a downward trend, due to a large number of long positions being liquidated. According to the snapshot from November 5th, more than 12 million US dollars worth of long positions were liquidated. This figure in itself is not particularly significant, but the liquidation of long positions indicates that there was a surge in buying interest for this asset, which was quickly suppressed.
XRP Ledger activated the fixCleanup3_4_0 repair proposal at 14:52 on November 4th. This fix removed a vulnerability: under certain circumstances, accounts authorized to destroy issuer tokens could also mint these tokens. Fortunately, the XRP native supply was not affected, so malicious actors did not take advantage of this vulnerability.
According to technical analysis, the price is trying hard to hold onto an important psychological level: the $1.2 mark has been breached, and XRP is currently trading around $1.2.
When the price moved towards the EMA on the 21st, an influx of trading volume suggested that market conditions might improve. However, on Friday, as we entered the weekend trading period, the trading volume was low, which disrupted any bullish plans.
Looking ahead to the future market, XRP is clearly still in a longer-term downward trend; however, it is more likely that we will first see a short-term rebound around $1.25. The crossover of the 100-day EMA and the 50-day EMA EMA will only be seen as a signal of further weakening and an acceleration of the downward trend (highly likely to go down).
Multiple on-chain indicators for XRP Ledger have shown significant growth, but unfortunately, this is not sufficient to support the price. A large amount of activity on Ledger seems to be automated, possibly coming from trading robots or more complex LLM models. The market is primarily driven by speculative interest, rather than the actual usage of the network's fundamentals.
Hyperliquid futures registration sees a slight rebound
Hyperliquid fell by nearly 9% on November 5th and is currently trading below $80. It is temporarily supported by the 100-day EMA moving average, but this average has been briefly broken below. From a fundamental perspective, Hyperliquid Strategies ( PURR ) has disclosed that it has applied to become a US futures broker. If approved, it will be able to direct US customers to the perpetual market deployed on Hyperliquid.
In addition to this important regulatory progress, Hyperliquid also announced quarterly net profits of $620 million, which include unrealized HYPE revenues of $803 million. Previously, on October 29th, Hyperliquid also announced a separate ICE-Trade agreement; more details can be found on the official website of SEC.
From a technical perspective, on the HYPE / USDT daily chart, the price has slightly rebounded from a local psychological support level of around $77. This represents a recovery point for Hyperliquid, but if selling pressure continues to emerge, it is unlikely that this support level will be maintained.
The momentum indicator RSI is moving in the positive 40 range, so if the bearish pressure here mainly comes from speculation, any decline could be short-lived. However, as trading volume increases during this local downtrend, the bearish trend is being strengthened.
Hyperliquid ( HYPE ) lost its upward momentum at the end of September, and a lower high was formed in early October, which is essentially a major signal that the upward trend has ended. Although there was a surge in early November, it still resulted in only a lower high, indicating that the bearish trend has not yet concluded.
Considering the unpredictable nature of the market, it is relatively difficult to make such a judgment. However, prices hardly have any support left; the next support level is the 200-day EMA (the black line in the chart), which corresponds to around $68.
On the other hand, trading volumes are declining, which could either be a normal phenomenon before entering the weekend trading period or indicate that the current trend is weakening.
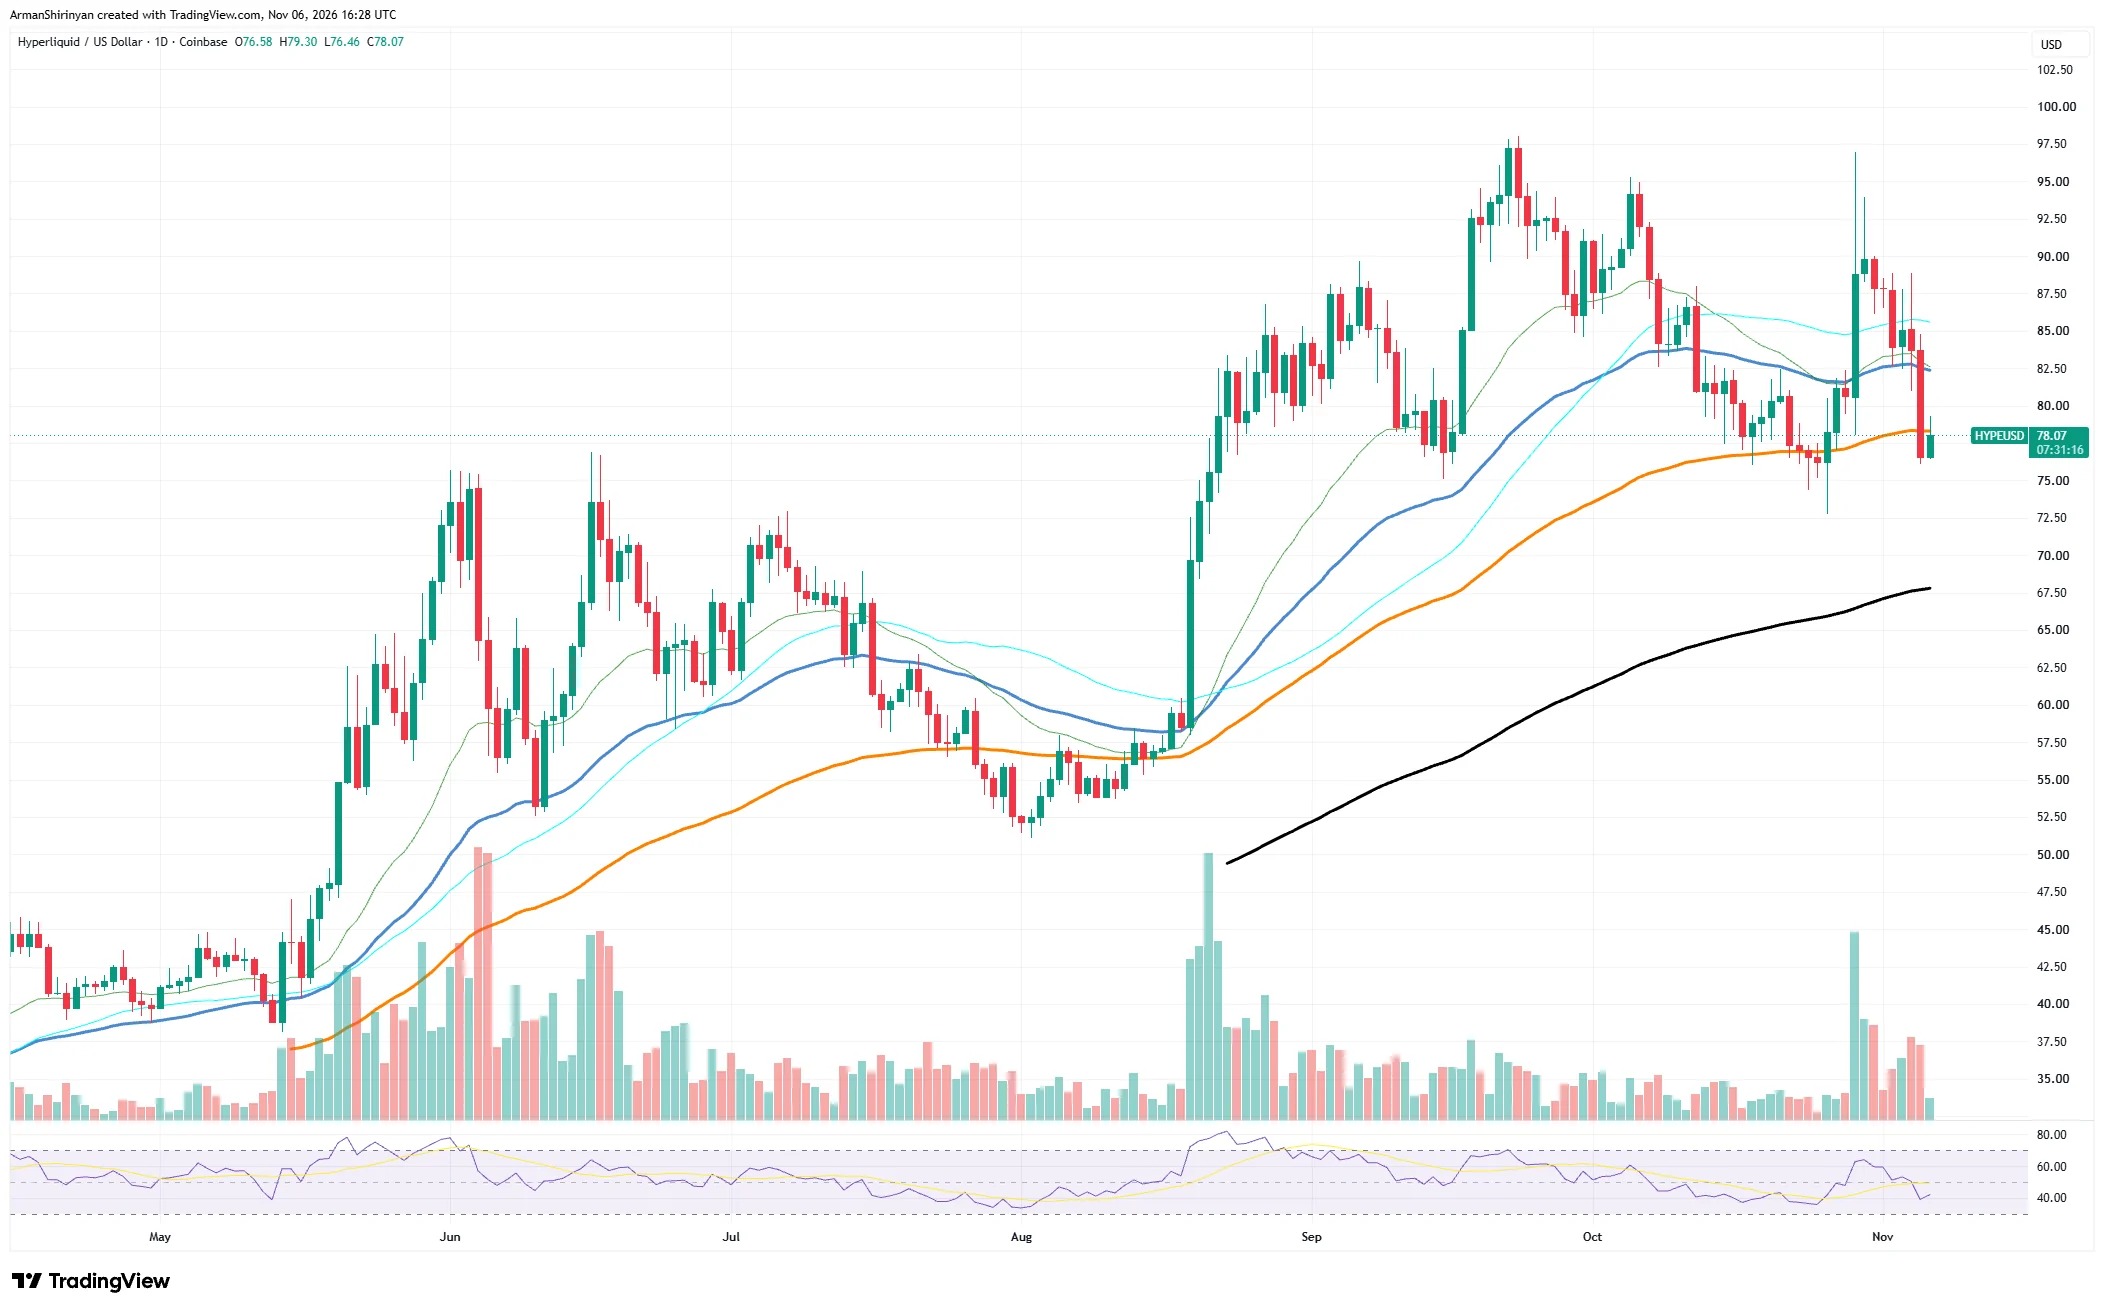
The key price levels for HYPE are as follows: $80 is the recent psychological support level, $68 is the 200-day EMA, and $89 is the first psychological resistance level. The trend line resistance level is around $84, so if a breakthrough can be made at that level, it should serve as the foundation for a price rebound.
Stellar ( XLM ) Leverage long positions continue to apply pressure
After Stellar ( XLM ) fell to $0.157, we have reason to believe that the market is beginning to accumulate buying interest, or at least transitioning into a sideways trend. The moving averages have not converged, which indicates that the trend is accelerating, and in this case, it is a bearish trend that is accelerating. Whenever the moving averages converge, volatility is more likely to soar.
The trend of Stellar is accelerating, yet trading volume remains low and neutral.
The slowdown in trend around $0.15 for XLM is not coincidental, as it coincides with the starting point of the previous trend. The death cross that appeared at the end of October is also a bearish signal.
Subsequently, there was a surge in trading volume, which confirms the importance of this indicator and suggests that the trend may continue.
However, the mainnet validator voting will take place on November 23rd at 17:00 UTC. Once that is completed, the updates will be made available to mainnet users.
After a bearish price movement in the market, 500,000 XLM long positions were liquidated. However, considering the total supply of XLM on the exchange, a liquidation of less than 1 million units is unlikely to affect prices, and its impact on the market is also very limited.
From a momentum perspective, RSI has already approached a local bottom. Although it has fallen to around 30, it is still possible for it to decline further. As long as there are still profitable funds in the market, the oversold RSI is not really a problem.
Considering market performance, the buying support is likely to be concentrated in the range of $1.5 to $1.6. Therefore, if the price falls below the $1.5 support level, it could trigger further declines and may even accelerate its movement towards $1. However, this is not common and would only occur in an extremely bearish market environment.